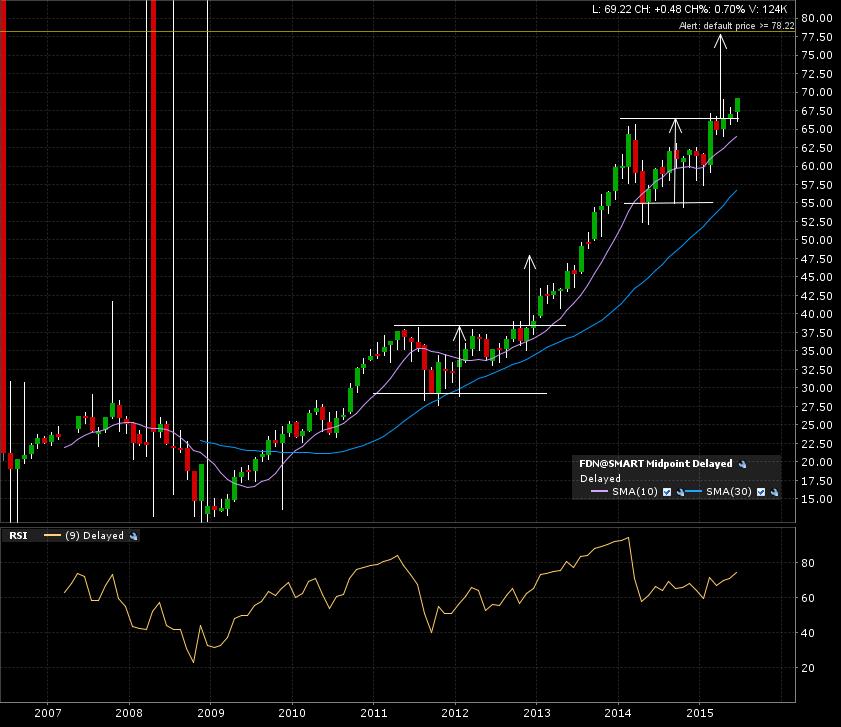
One of my bullish alerts got triggered for First Trust Dow Jones Internet Index (FDN:ARCA). Here is a look at the 9 year monthly candle chart. After hitting a previous target, the move is now on for the next leg up. Target is 78.50.
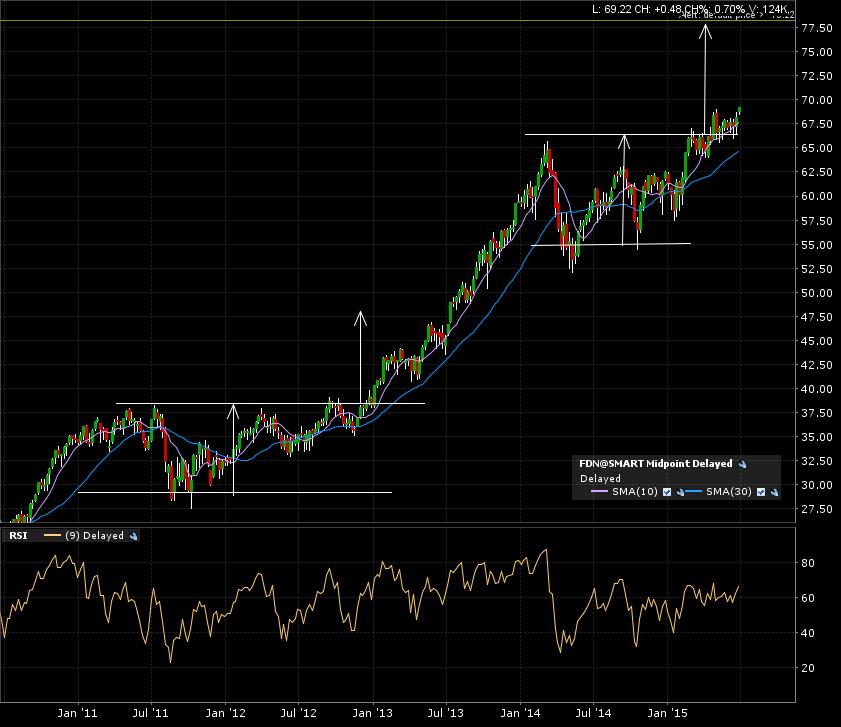
Now the 5 year weekly candle chart. Some consolidation around the breakout line of 67.50.
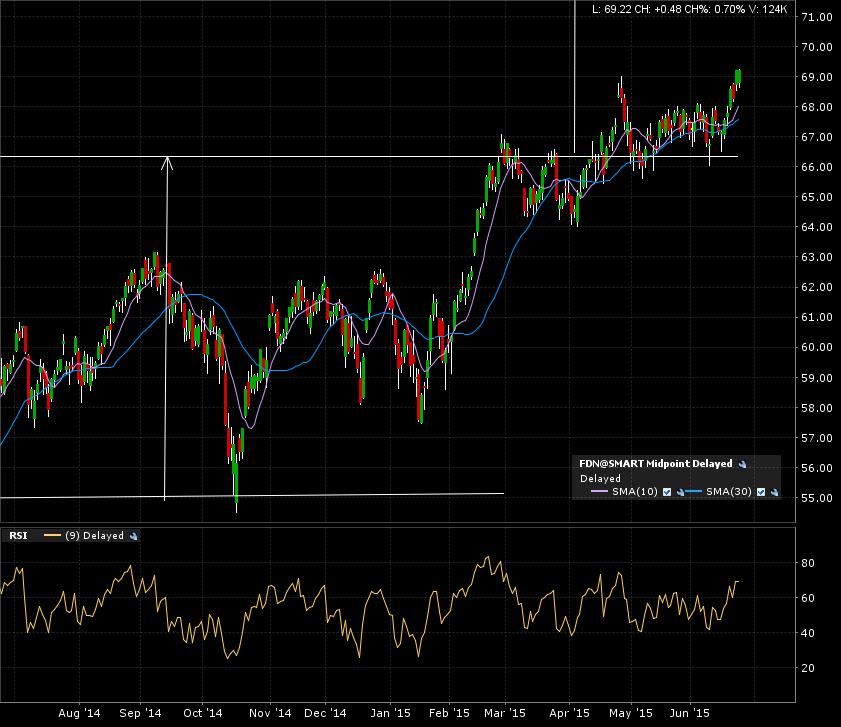
Zoom in on the 1 year daily candle chart. You can see the recent price action congestion in more detail. This is also what I consider “noise”. Check my previous post about this important concept.
I’ll wait for the end of monthly candle close. If the price remains above the breakout line, I’ll then refer to my risk management protocols and evaluate if the press is worth the squeeze! Check it out here.