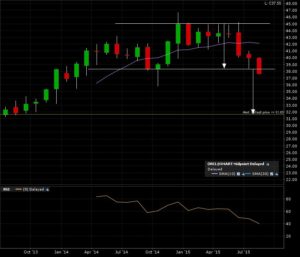
Oracle (ORCL:NYSE) is breaking down on the monthly candle chart. A monthly candle close below 38 will give a target of 31.
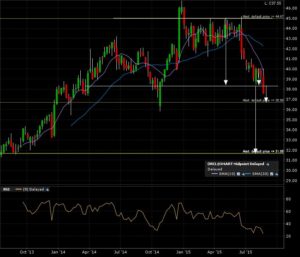
The weekly candle chart show more of the same. Watch out for support around the 36 area.
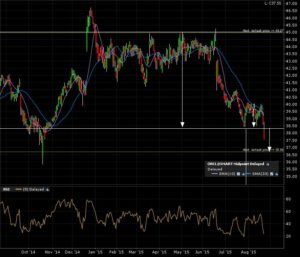
Zoom in on the 1 year daily candle chart. A little more detail on that possible support from tested earlier this year.
Lets wait another week, close out the month’s candle and see if the risk to reward gives us an opportunity to see the bearish possible future for Oracle come to fruition. Check my “How To” here.


