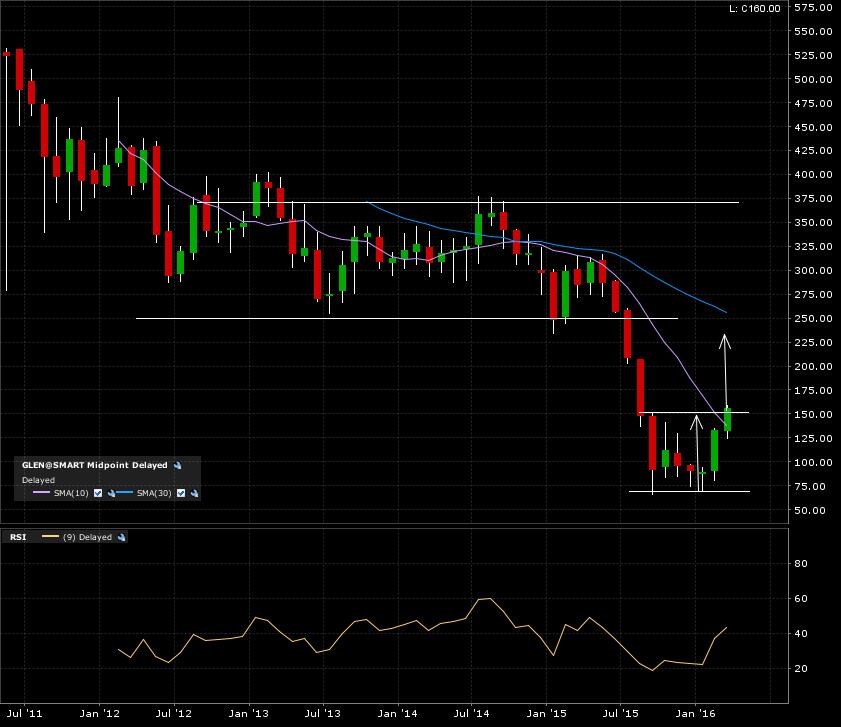
Looking at Glencore (GL:LSE), we see a possible bottom formation breaking out. This might lead to a return to the previous breakdown level at 250. Check out the monthly candle chart.
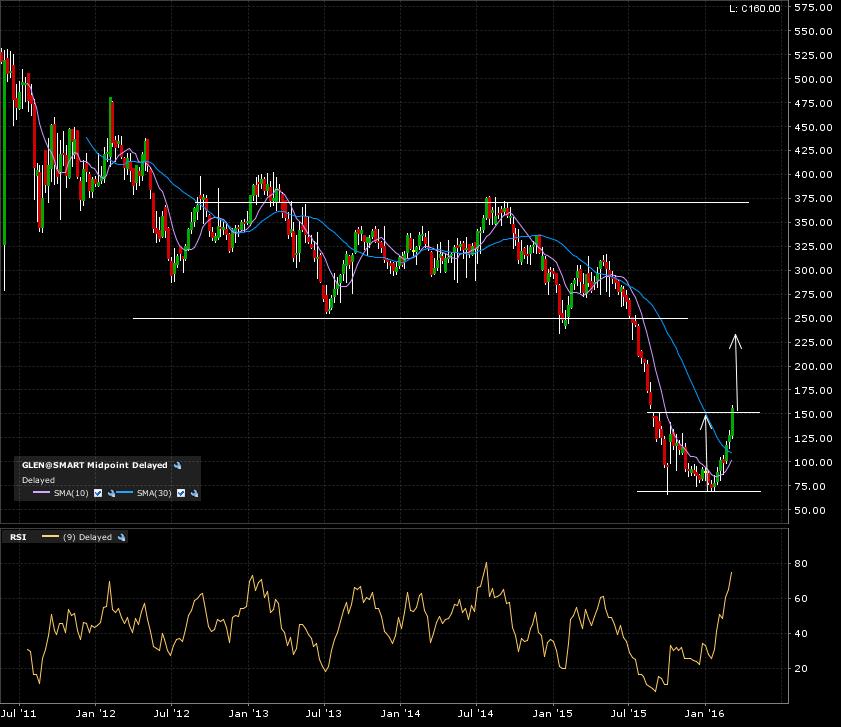
The weekly candle chart is more of the same.
A final zoom in on the 1 year daily candle chart.
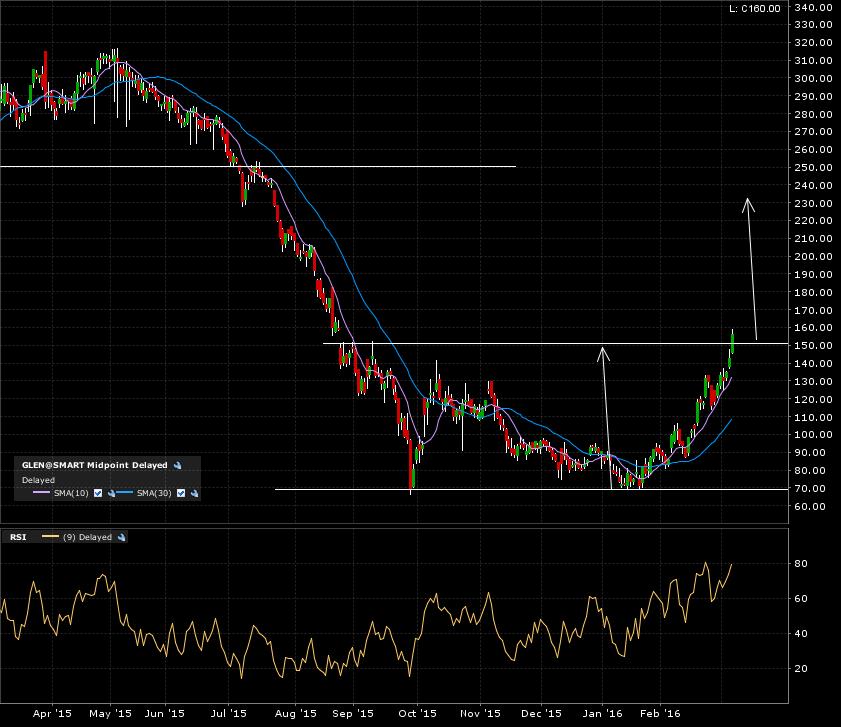
This is breaking out on the daily, weekly and monthly candle charts. Just need to wait for the monthly close for confirmation.