Nice +1 year falling wedge (reversal pattern) ongoing for angi. Check out the monthly candle chart below.
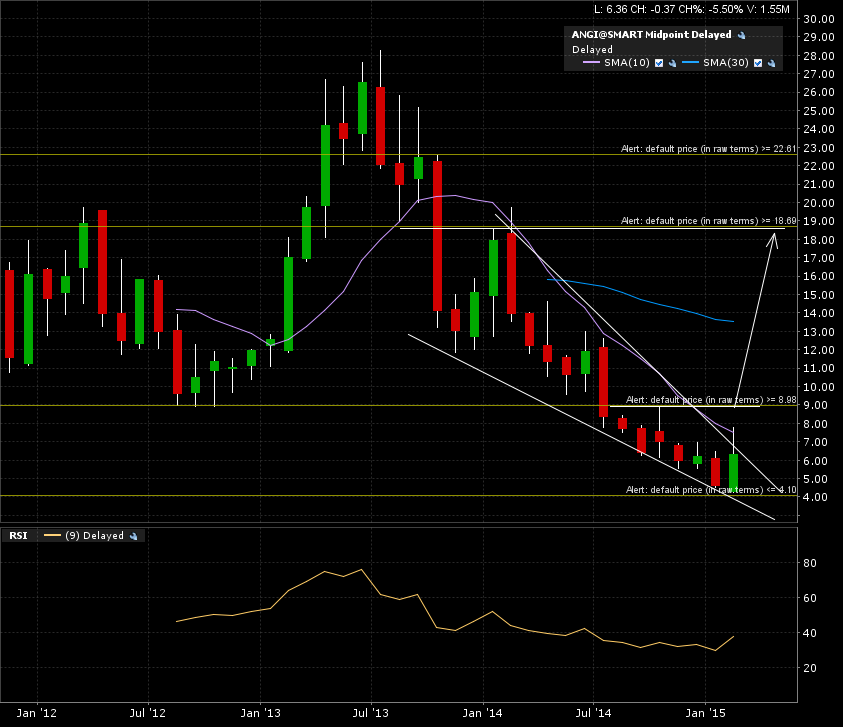
The arrow is the implied move for a completed falling wedge classical chart pattern.
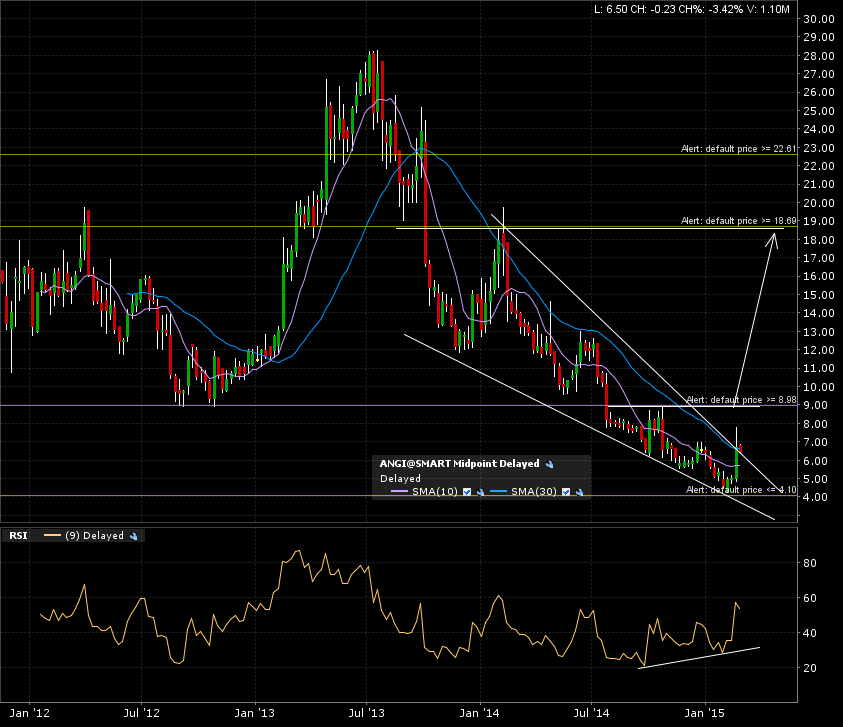
The weekly candle chart shows the horizontal resistance line I’m watching for the confirmation breakout. Notice the bullish divergence with the RSI, that adds value to the bullish reversal scenario.
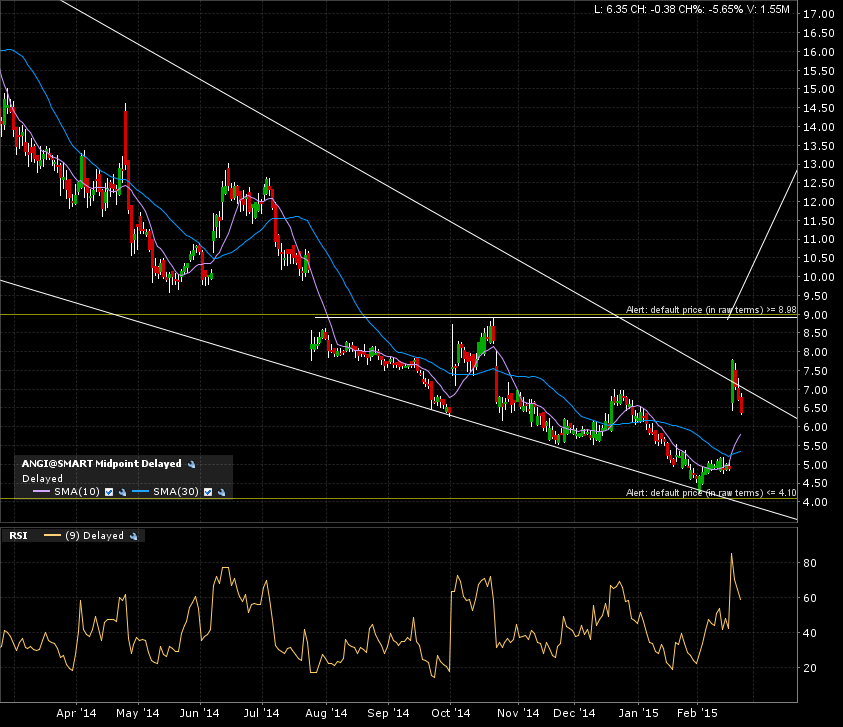
The 1 year daily candle chart shows the price action underneath the breakout line.
Set your alert at the 9 mark. I’m waiting for a monthly candle close above that level for confirmation. IF a monthly candle close above, then the target is 19.
There is also a bearish scenario if the price closes under 4. But I’m hoping more for angi to go to heaven, not hell!