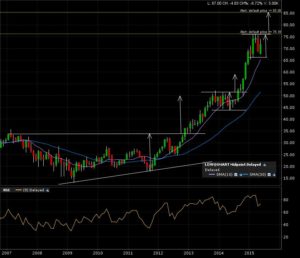
Lowe’s Companies Inc. (LOW:NYSE) has a VERY similar chart as Home Depot, Inc. (HD:NYSE) . Check out this previous post. Here is the monthly candle chart for LOWE. After 2 previous targets reached, a 3rd continuation pattern OR top is in the works.
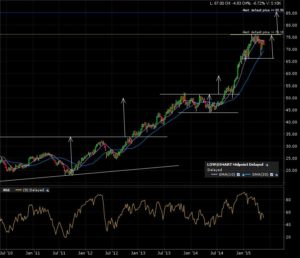
The 5 year weekly candle chart shows more of the same.
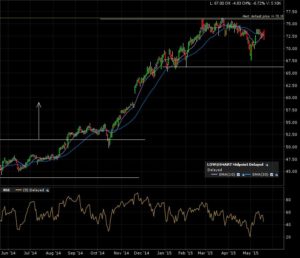
Zoom in on the 1 year daily candle chart. Price action testing both sides of the consolidation pattern.
My alert is set for the bullish continuation breakout at 76. A monthly candle close above that will give me an implied measured move added to the breakout line (resistance) of 85.50.


