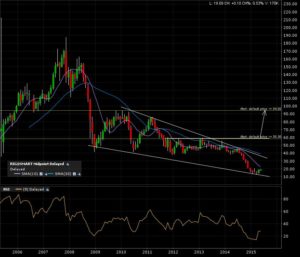
Transocean Ltd. (RIG:NYSE) is in progress of a HUGE +6 years “falling wedge reversal” classical chart pattern. Check out the 10 year monthly candle chart.
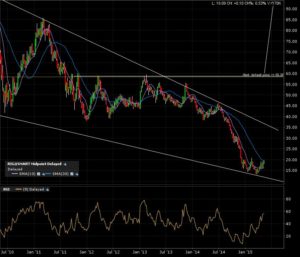
The 5 year weekly candle chart shows the recent test of the lower descending boundary.
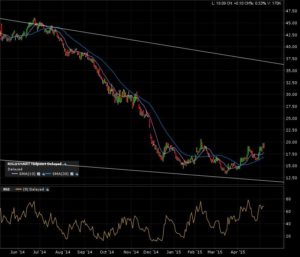
Here is the zoom in on the 1 year daily candle chart. Still far off the next test of the upper boundary.
I set my alert at the breakout line of 58.50. A monthly close above that horizontal trend line will confirm the retrace to the top of the “falling wedge” formation of 94.


