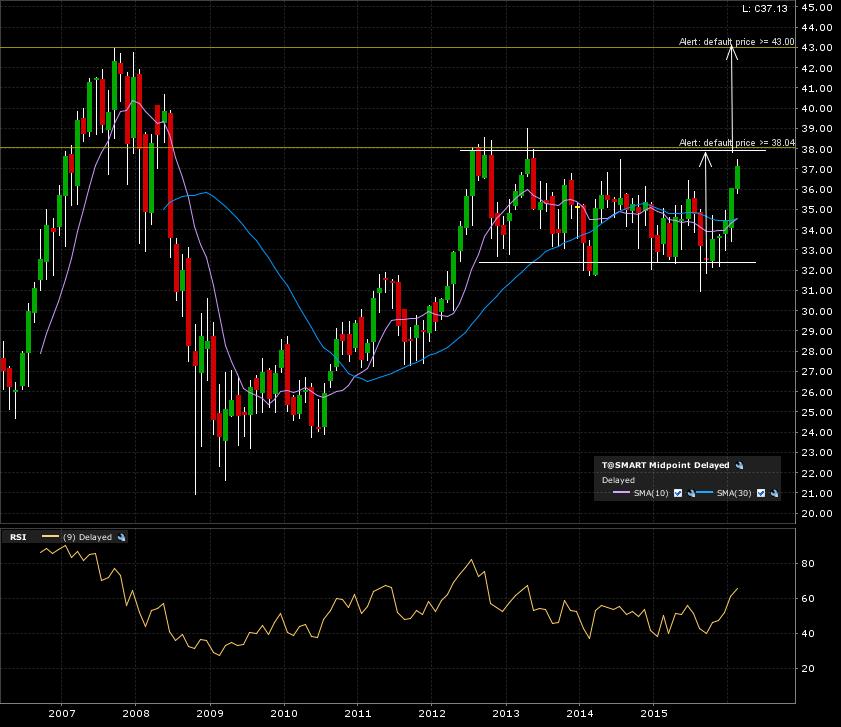
AT&T (T:NYSE) is approaching it’s breakout line of the BIG 4 year consolidation rectangle. A monthly candle close above 38 gives me a target of 43, which also coincides with the 10-year high. Check out the 10 year monthly candle chart below.
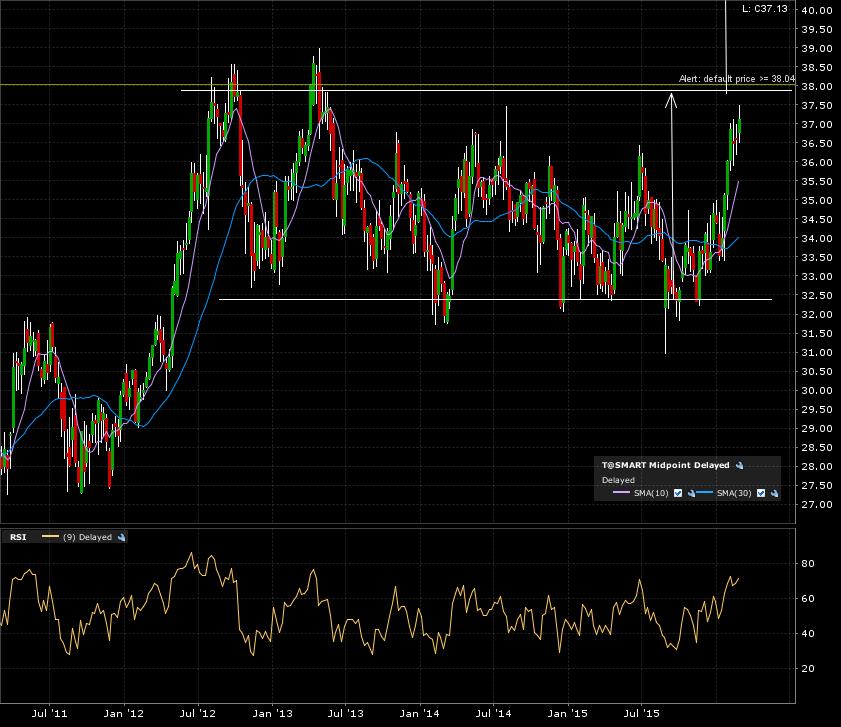
More of the same on the 5 year weekly candle chart.
A final zoom in on the 1 year daily candle chart. Price action is working it’s way to that important resistance at 38.
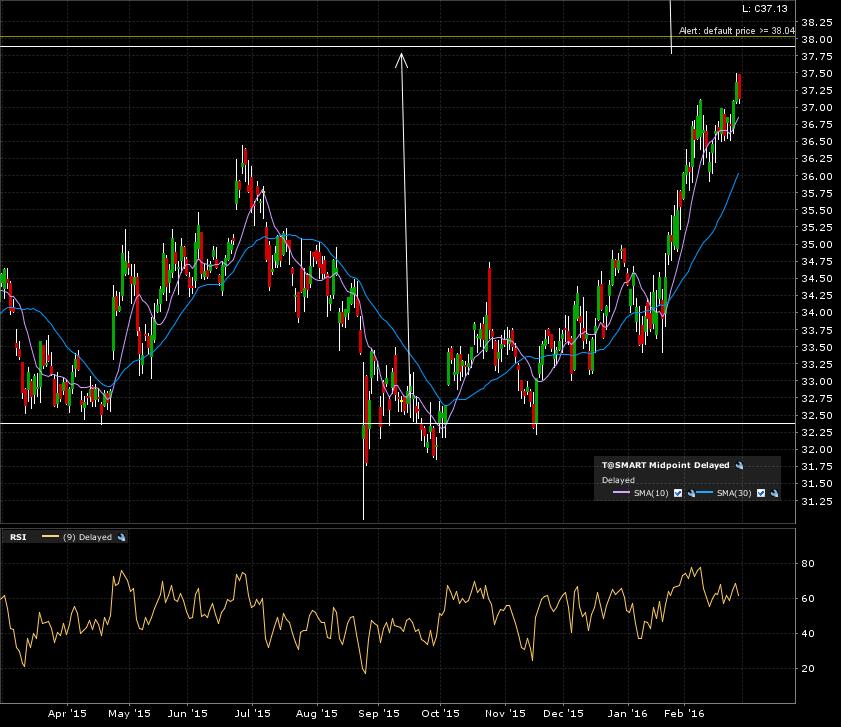
My alerts are set. Let’s see if we get that bullish breakout to those previous highs!