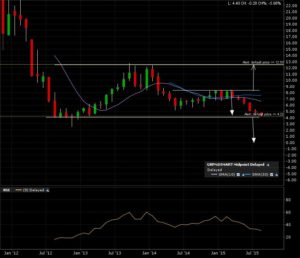
Groupon (GRPN:NASDAQ) is testing its bearish breakdown line on the monthly candle chart. A monthly candle close below 4 would signal a measured move to ZERO! The bullish scenario would imply a price action move back to the 8.50 level. A break above that would bring a target at 12.50. A secondary bullish move would be the break above 12.50, giving the furthest target at 21.
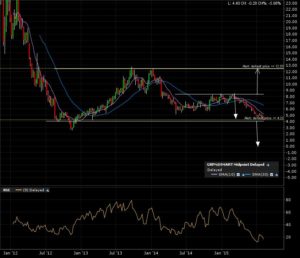
Here is the weekly candle chart. More of the same.
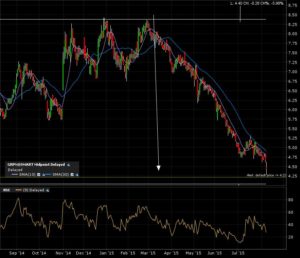
Zoom in on the 1 year daily candle chart. This has been trending lower for the past 6 months.
I have my alerts set. Although we are closest to the bearish breakdown, we have to remember there are always 2 possible scenarios, bearish AND bullish. Better be prepared for BOTH. For now, let’s see if Groupon can regroup!


