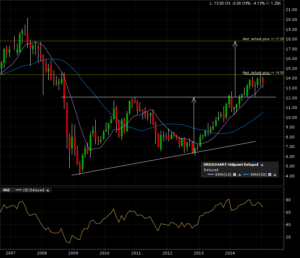
Xerox broke out of a 5 year base back in early 2014. The target is 18. Check out the monthly candle chart.
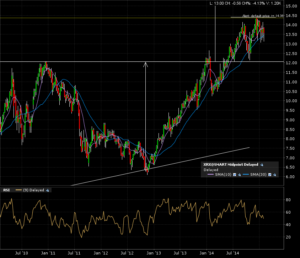
A closer look at the weekly candle 5 year chart shows some congestion (consolidation) in progress.
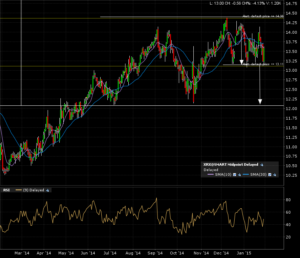
The daily candle chart shows us even more detail, but also noise. There is a short term bearish target back to the breakout line if the 13 mark is broken.
The longer term trend is bullish (as seen with the monthly candle chart), so that is the play I would want to go with. I put alerts at those key levels, but the main interest is a breakout of the consolidation pattern at 14.50.
Let’s keep a fresh copy of this play in mind!


