What happened here? Huge drop this week for Bombardier. I’m going to look at this for an eventual bullish move.
Otherwise, a bearish look would see this stock in the wonderful penny stock land!
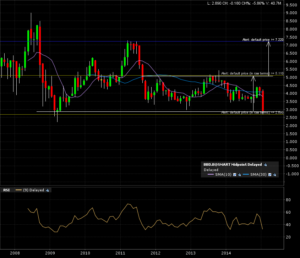
On the monthly chart, we can see previous lows are close to being fully tested:
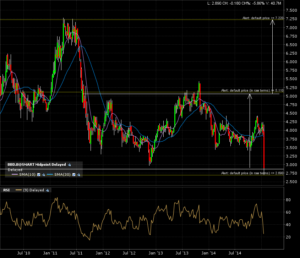
Here is a zoom in on the action on the 5 year weekly candle chart:
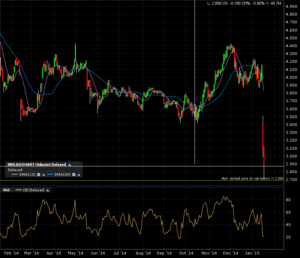
We can see the gap down on the yearly chart with daily candles:
I’m keeping an eye on this for an eventual return and close above 5.10. A close above this will give me an implied measured move to 7.22.
That’s about it, other than trying to catch a falling knife…


