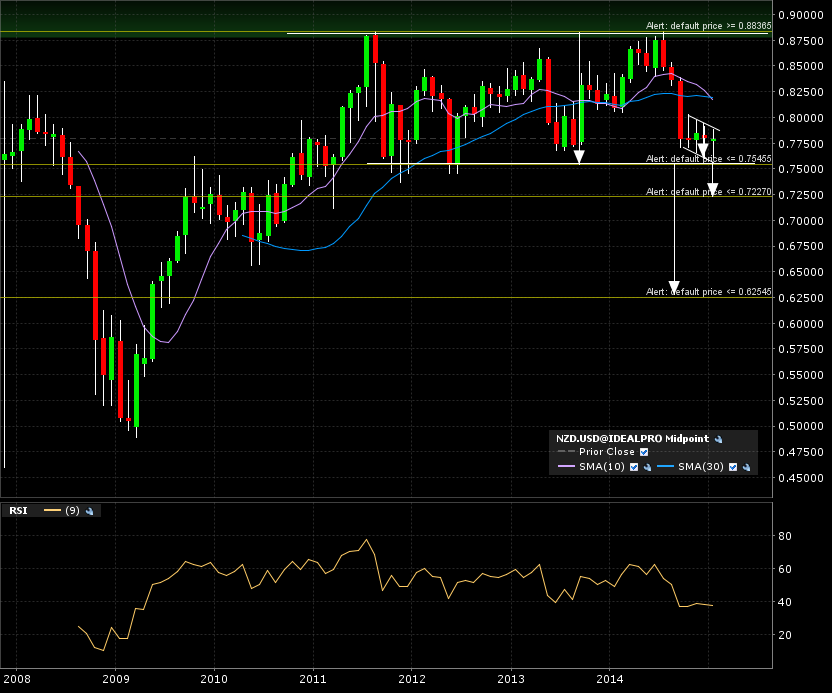
We got about a 4 year top formation going on for nzdusd. I’m gonna look at the closest scenario, which is a bearish breakdown of the pair.
A look at the monthly candle chart show us the lower boundary area is being tested. A break with a monthly close below the 0.7500 would give me a measured move to 0.6250. This target would coincide with the previous bullish breakout area back in 2009 (which could serve as support once reached).
Now lets zoom in on the weekly candle 5 year chart. Notice the previous support around the 0.7250 area. This might hinder our monthly target on it’s path. However, the intermediate play on the weekly candle chart would be the bearish channel close to that monthly breakdown point. It’s target would bring us to the previous support area, making us take profits in case of a bounce off that.
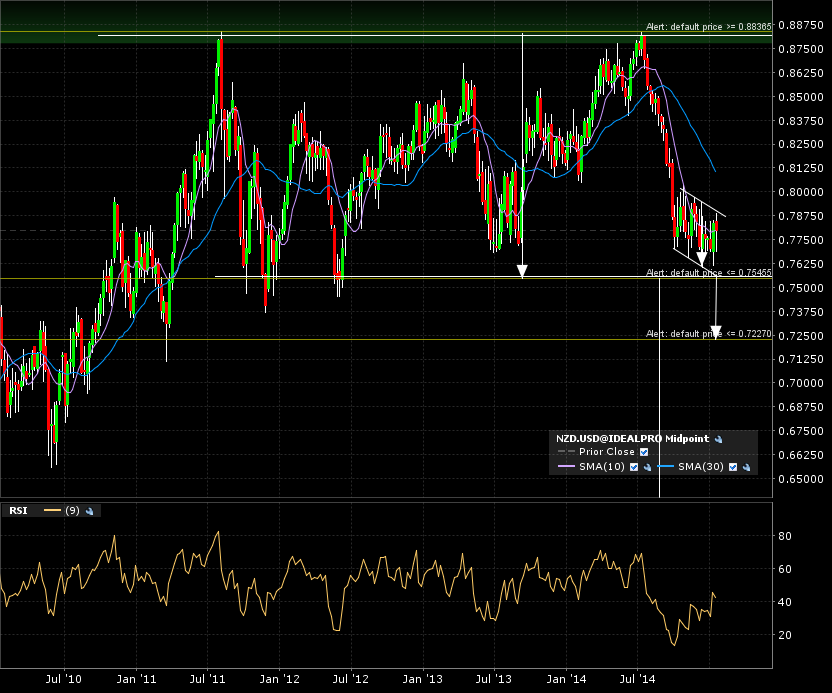
Weekly time frame breakdown setups coinciding with the monthly time frame breakdown, gives added strength to the breakdown direction.
On the daily candle chart (1 year), we can pinpoint the action. There is still some time before the setup comes to maturity.
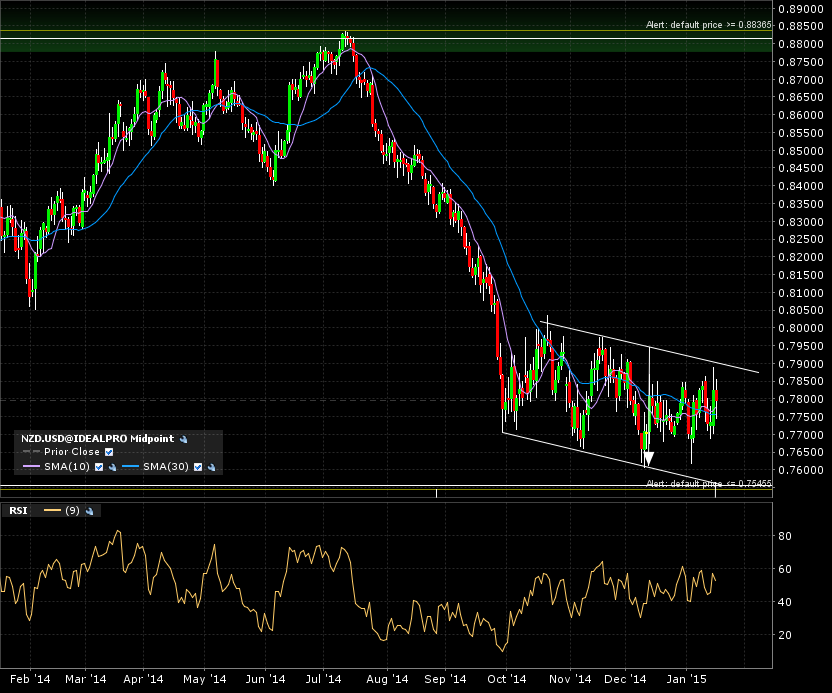
In the meanwhile, go buy some kiwis at the grocery store, cause they haven’t fallen off the tree just yet…