Lot’s of slipping possible with SPDR S&P Oil & Gas Exploration & Prod (XOP:ARCA). After a fall off it’s mountain top, a consolidation period has broken down to have the price action now testing it’s important breakdown line (support). Check out the monthly candle chart. I have the breakdown line at 37. A monthly candle close below that would give me a mesured move to 20 (coincides with preivous lows from December 2008).
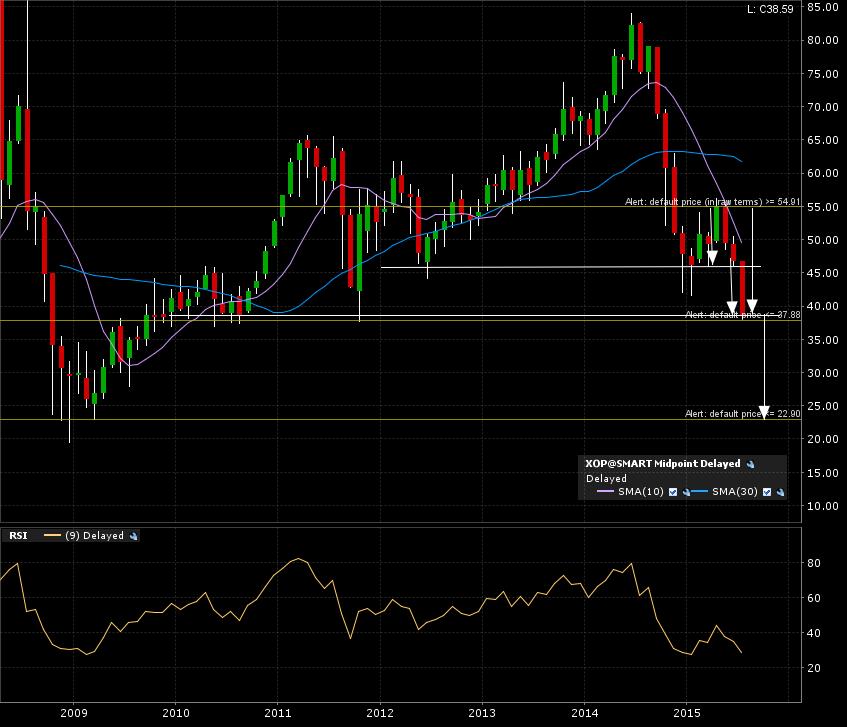
Here is the 5 year weekly candle chart. Some noise on the way to bringing the price close to the breakdown line.

A final zoom in on the 1 year daily candle chart. More of the same bearish trend.

I set my alert and will come back to this after getting a trigger. Hopefully a monthly candle close below that level will confirm the next target. Go check out my “How To” to better understand my trading framework.