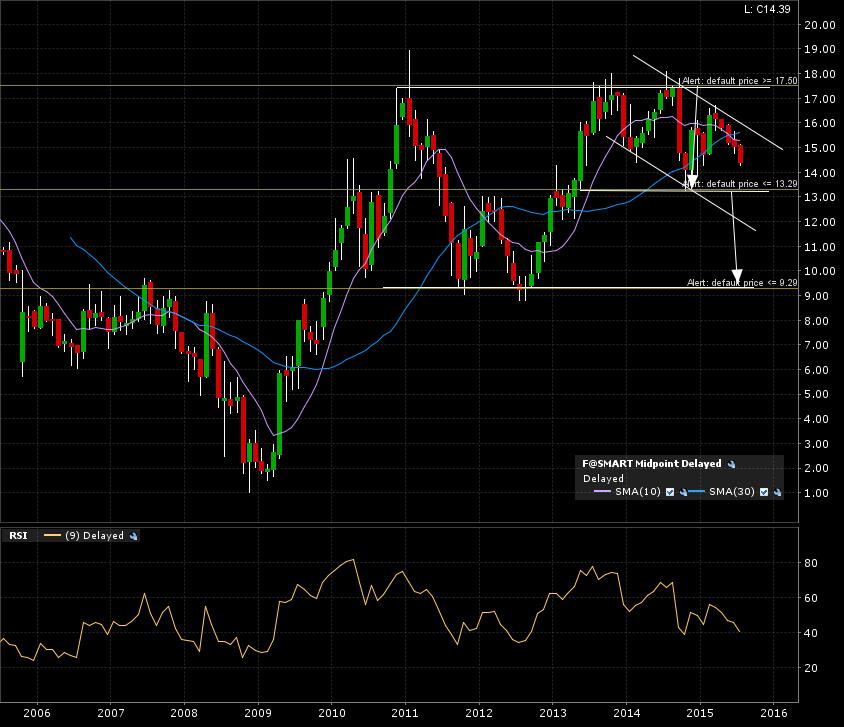
Ford Motor Co. (F:NYSE) is possibly topped and heading to previous support levels. There is a +2 year descending channel which is leading to the top formation’s breakdown line (support) at 13. Check out the 10 year monthly canlde chart. Arrows indicate the implied mesured move added to the breakdown line. A monthly candle close below that level would confirm the 9 target. That target also coincides with the breakdown line of the HUGE 6 year top formation. A confirmed breakdown of that HUGE top formation would be the late 2008 lows of 1 dollar!
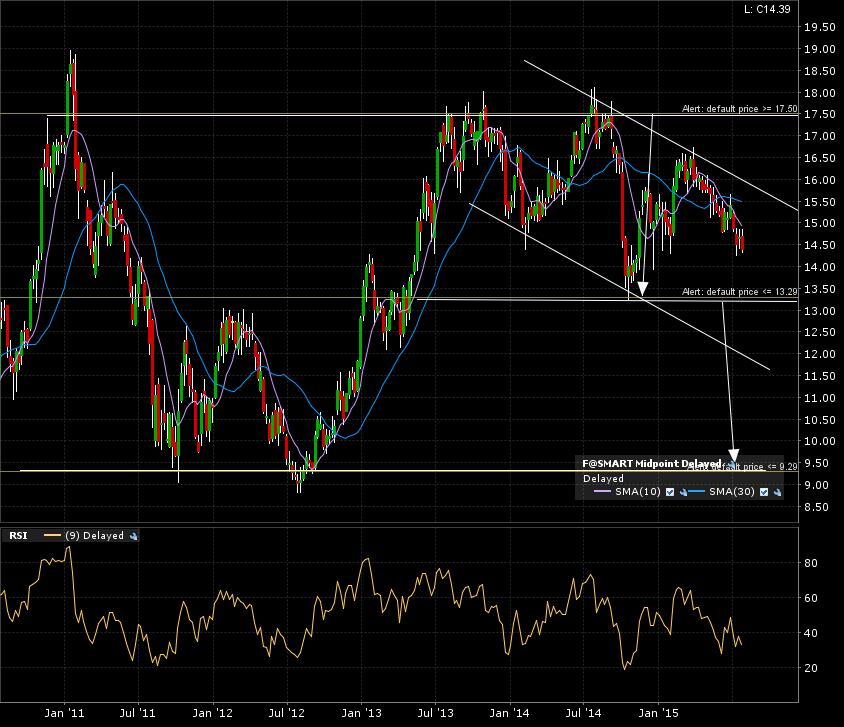
Here is the 5 year weekly candle chart. A couple of bounces off the upper boundary of the descending channel. Price action trending towards to breakdown line.
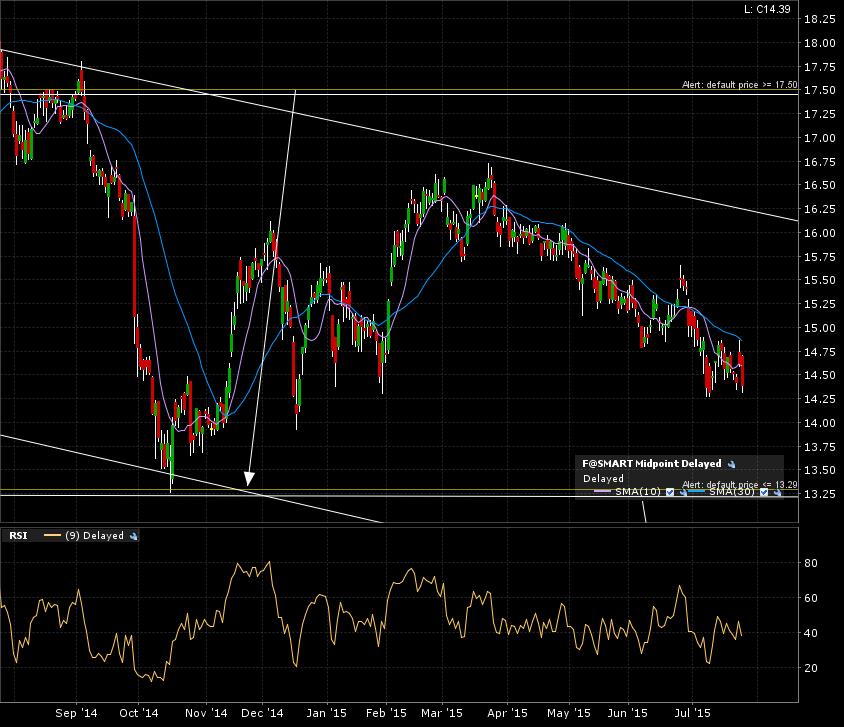
A final zoom in on the 1 year daily candle chart. More of the same down trend, sbut still in no man’s land.
I set my alerts and will come back to this chart once trigerred. Patience required.