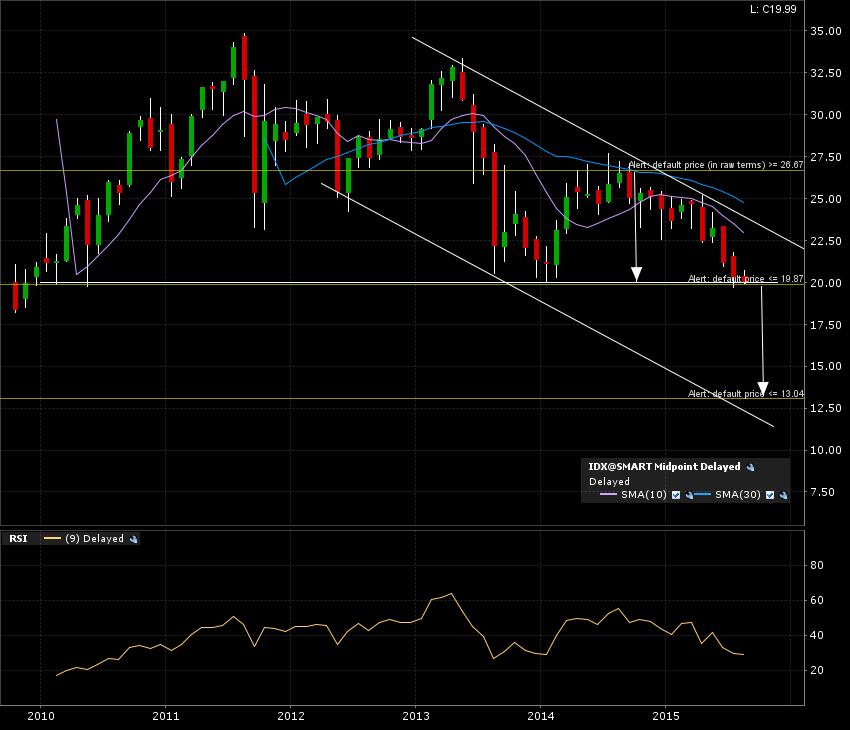
Market Vectors Indonesia Index ETF (IDX:ARCA) is testing it’s breakdown line on the monthly candle chart. There is also a bearish pattern in the works with a “descending channel”. The arrows indicate the implied measured move added to the breakdown line of 20. A monthly candle close below that level would confirm the target 13. No “WALLS” insight, good! Check out my concept of walls here.
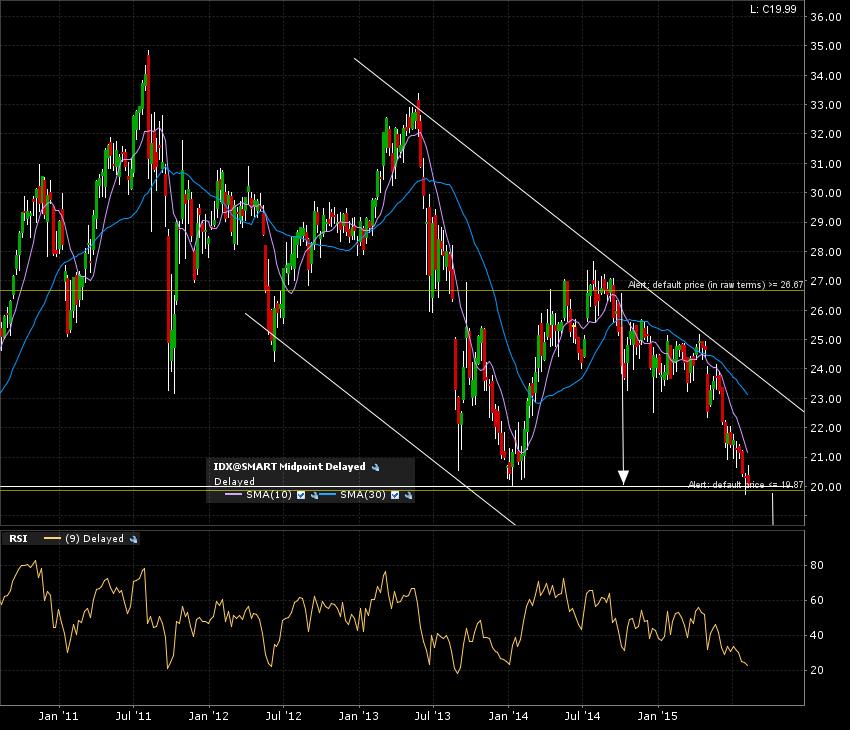
Here is the 5 year weekly candle chart.
A final zoom on the 1 year daily candle chart. Here is also an example why to used larger time frames. You couldn’t tell from a 1 year chart that the 20 level was an important breakdown line (support).
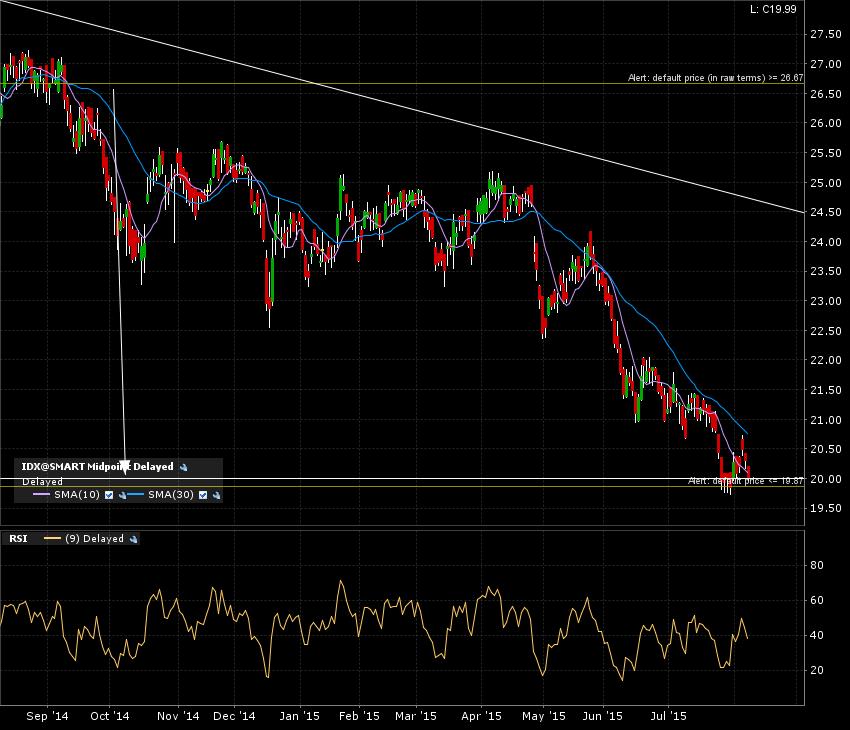
I have my alert set at 20. Will come back at month’s end to see where the price action sits. Let’s see if this will go down under!