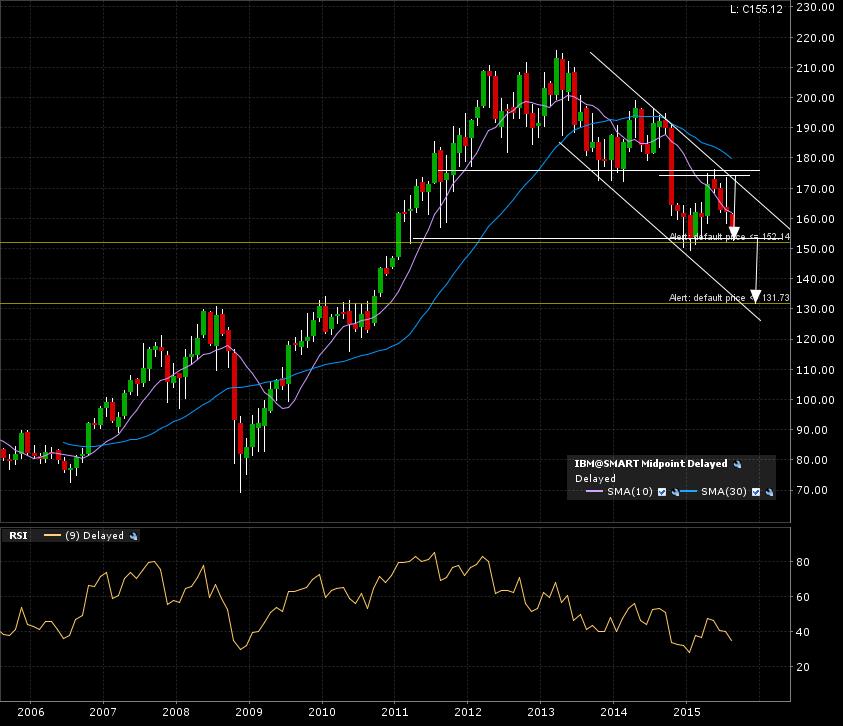
Some time has pass since my post on IBM (IBM:NYSE), morphing has occurred. Check it out here. Also, here is my post covering the concept of “morphing”. There is now a “descending channel” adding to the still current top formation. Target is now at 130 (also a WALL), just now the breakdown line is clearer after a few monthly candle tests at 150.
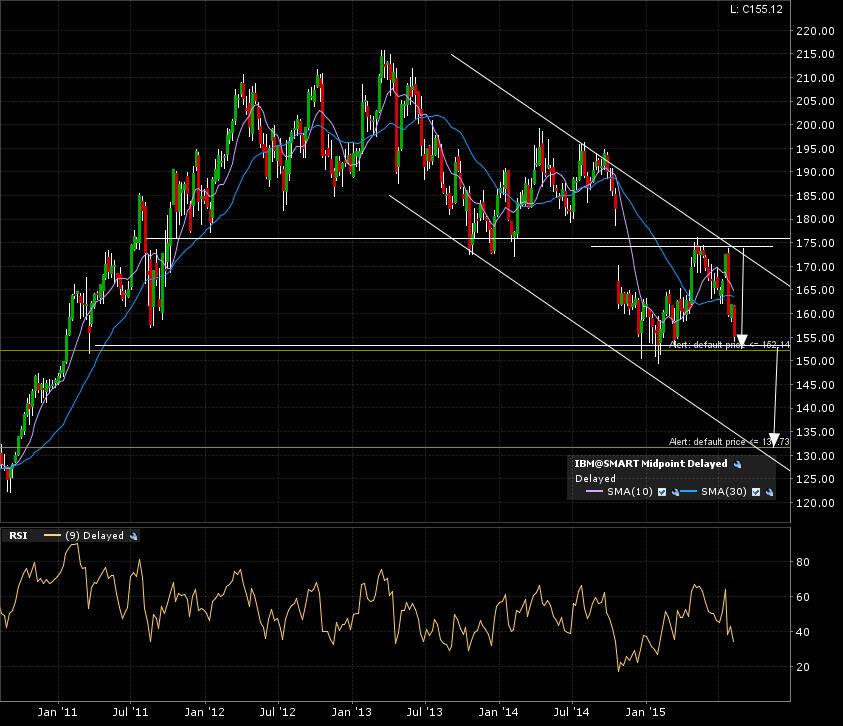
The 5 year weekly candle chart shows more of the same as the monthly candle chart.
Zoom in on the 1 year daily candle chart. We can see the sideways consolidation for the past 10 months.
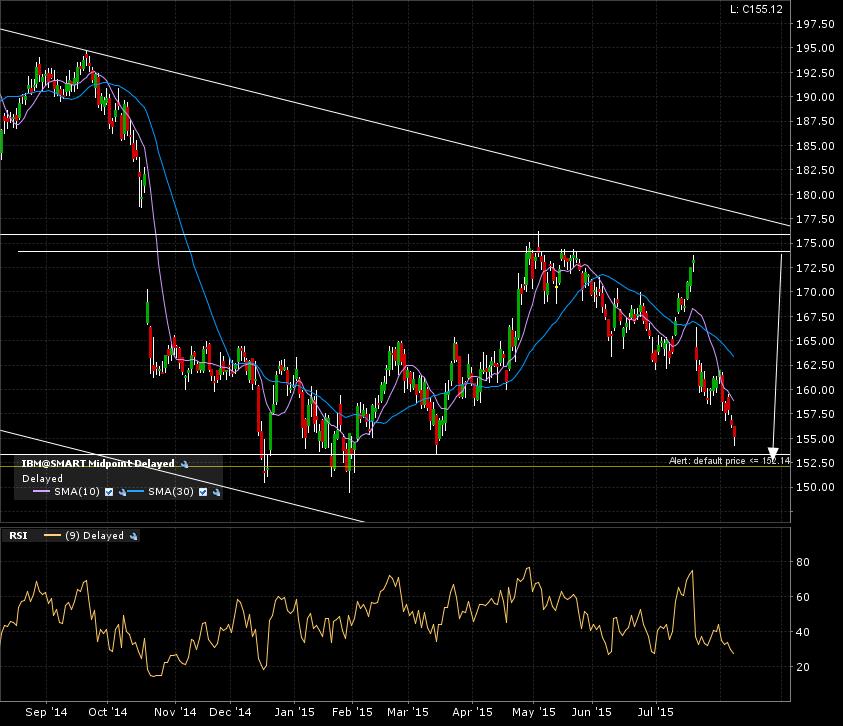
This big boy is dangerously close to breaking down back to it’s breakout levels of late 2010. I set my alert and will come back once triggered. A little more patience required.