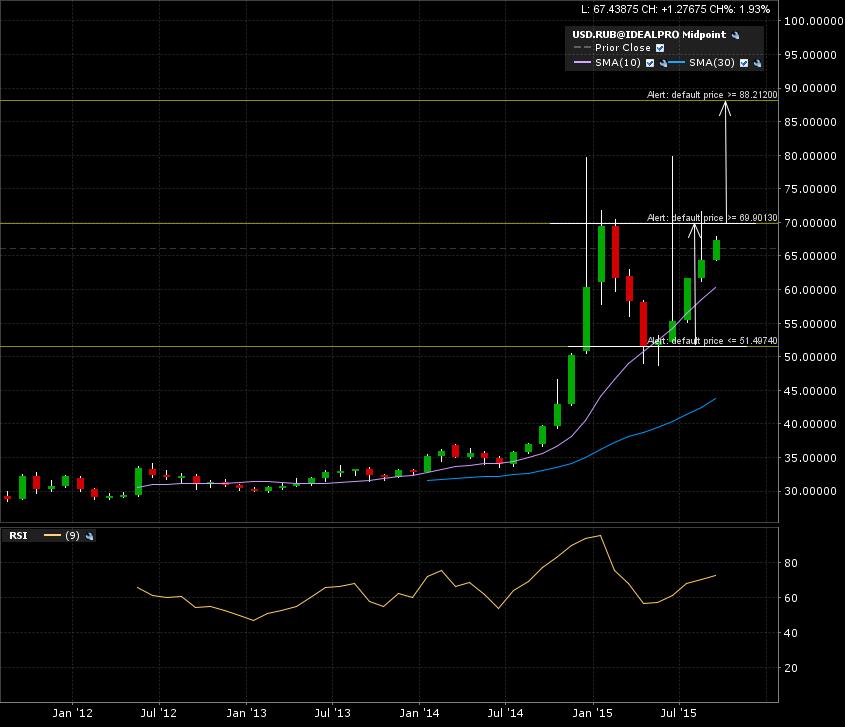
The usdrub forex pair is getting ready for a possible move. Here is the monthly candle chart. A top OR continuation pattern is in the works. I will take a look at the bullish scenario for now as the price action is closer to the breakout line at 70. A monthly candle close above that level and we get an implied measured move to 88.
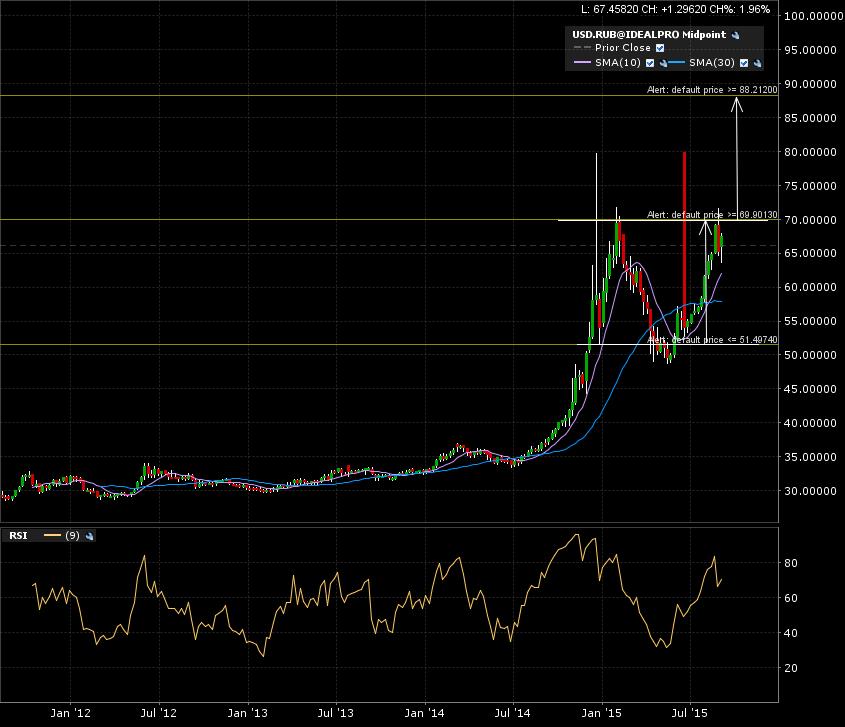
Here is the weekly candle chart. More of the same here.
A final zoom in on the 1 year daily candle chart. The support and resistance lines have been drawn.
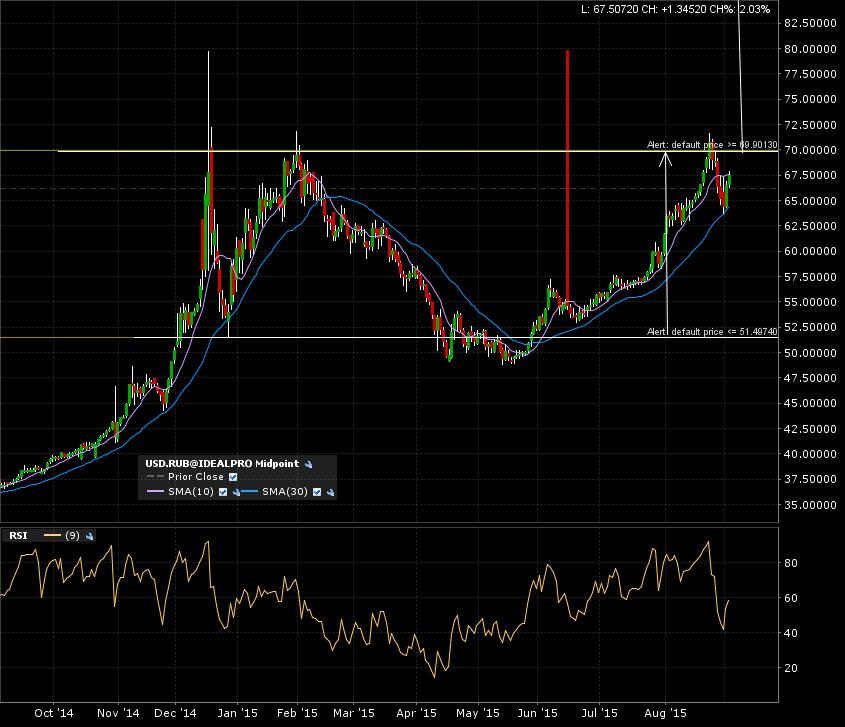
Some noise on the lower time frames. Best keep to the monthly candle charts o avoid whipsaws. Check this previous post on how to reduce “noise”. Alerts are set, will comeback when triggered.