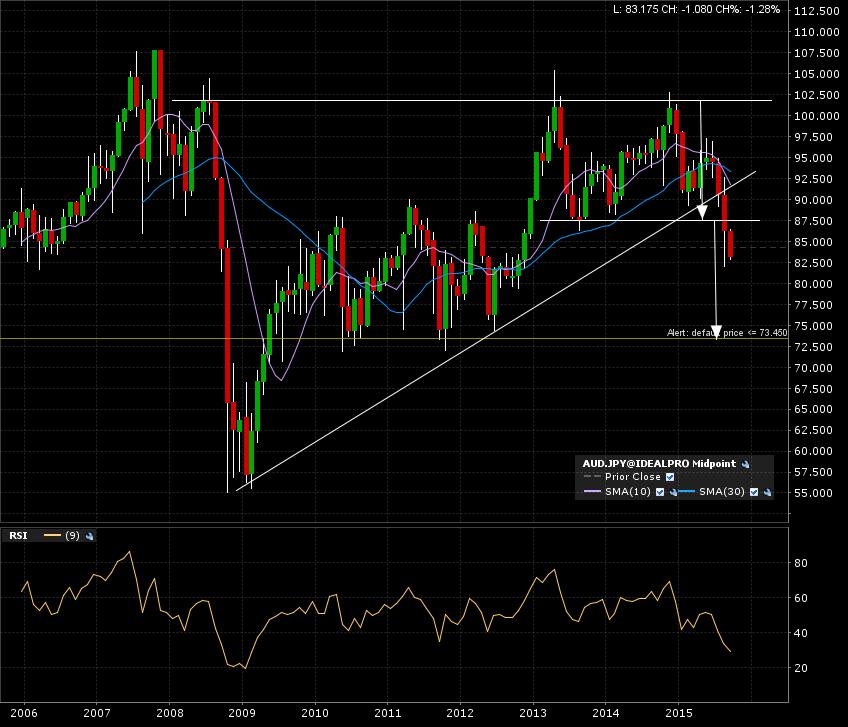
The audjpy forex pair has chosen the bearish ending. A break has happened below the 87.50 mark. Check this previous post from February 4 concerning this pair. Now enter the 10 year monthly candle chart. The implied measured move added to the breakdown line brings a target at 73.50. Remember, I often redraw my lines. At any given time, my view is skewed. How skewed? This depends on the day! My previous post on this pair had the breakdown line at 88 and a target at 74. I believe classical chart analysis is not a SCIENCE, but an ART. Art implies human behavior, thus the chart is drawn.
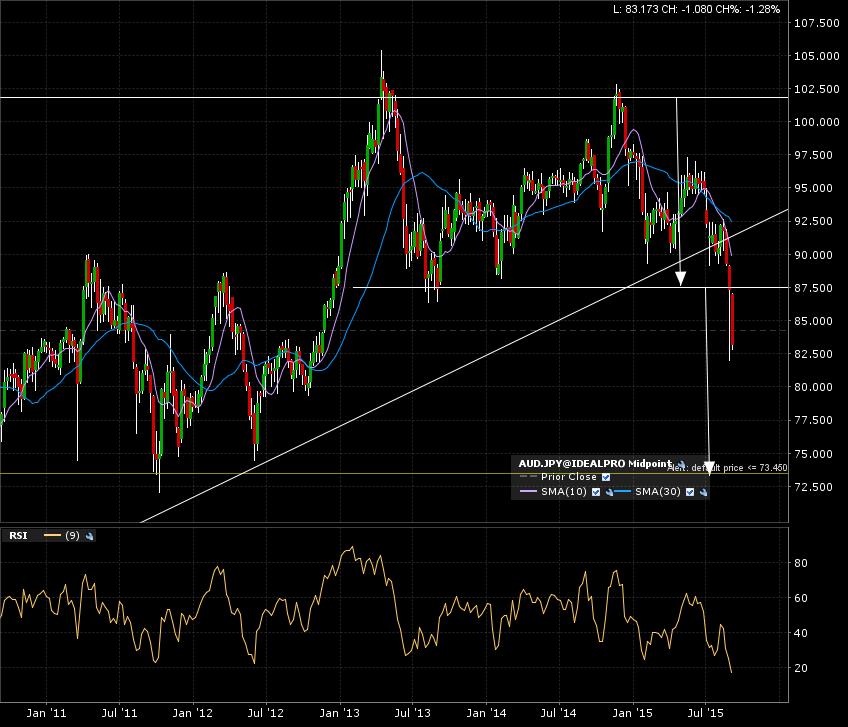
Here is the 5 year weekly candle chart. You can observe the +2 year top on this time frame.
Zoom in on the 1 year daily candle chart.
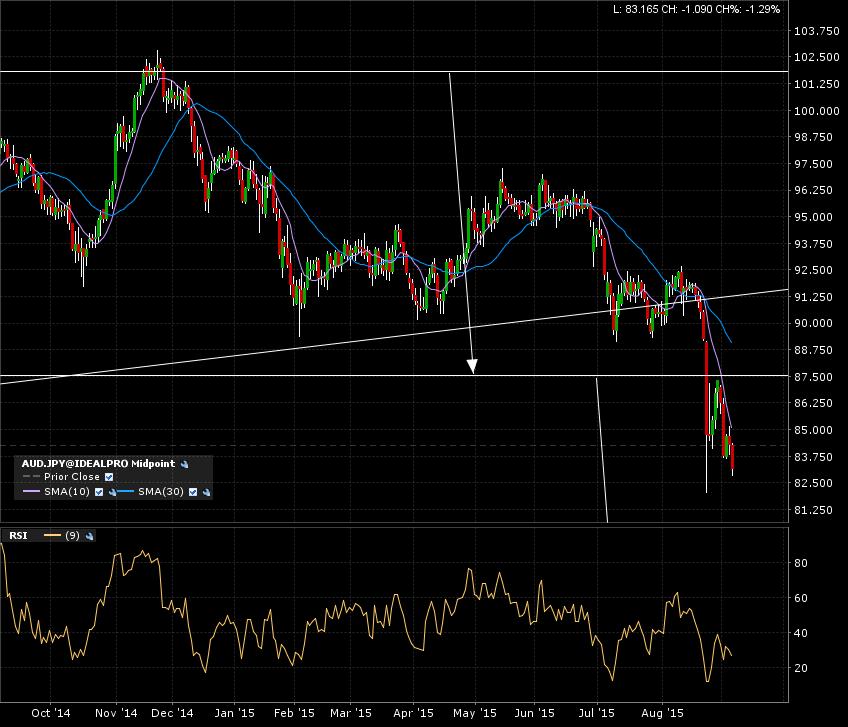
The target will bring us down to previous support, with no “WALLs” on the way, A+ materiel! Check this post on my concept of walls.
See you at target!