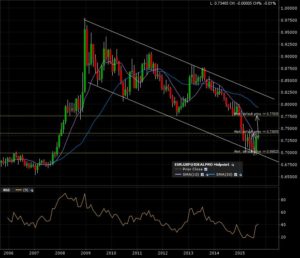
In the midst of a +6 year HUGE descending channel, the eurgbp forex pair might be retracing to the previous breakdown point, IF this current pattern resolves with a monthly candle close above 74. Target would then be 77.50. Check out the 10 year monthly candle chart.
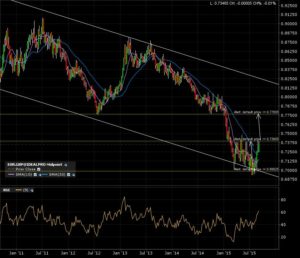
The 5 year weekly candle chart is all about this descending channel, test of the lower boundary and possible bottom at this level.
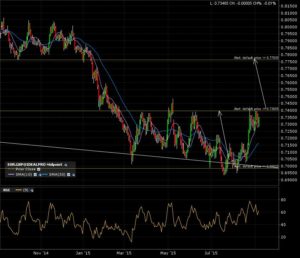
A final zoom in on the 1 year daily candle chart. The breakout line (resistance) is being tested for the past 6 months.
Nothing is set in stone right now. Set your alerts and wait for the monthly candle close to avoid whipsaw due to “noise“. See these previous post referencing the eurgbp pair, here and here.


