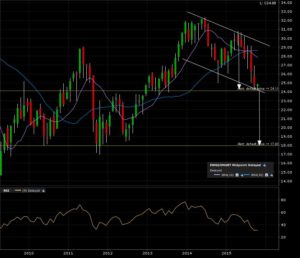
iShares MSCI Germany Index (EWG:ARCA) Is trending toward the lower boundary of it’s descending channel. Now also coinciding with the breakdown support line. Check out the monthly candle chart. A close below 24 would give a target of 18.
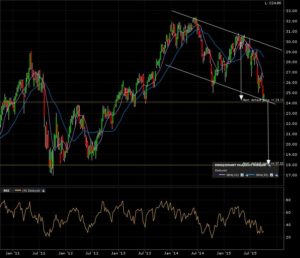
Here is the 5 year weekly candle chart. More of the same.
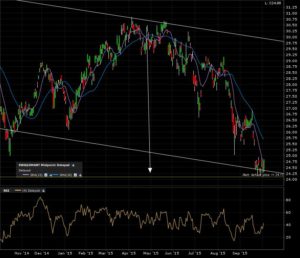
A final zoom in on the 1 year daily candle chart. Gap down visible on this time frame.
I set my alert. Let’s wait and see if this snake can bounce off that support!


