The eurgbp forex pair is breaking out of bottom formation. Check this previous post from Septembre 6th 2015. Target is a retrace back to the preivous breakdown level, which is also a WALL.
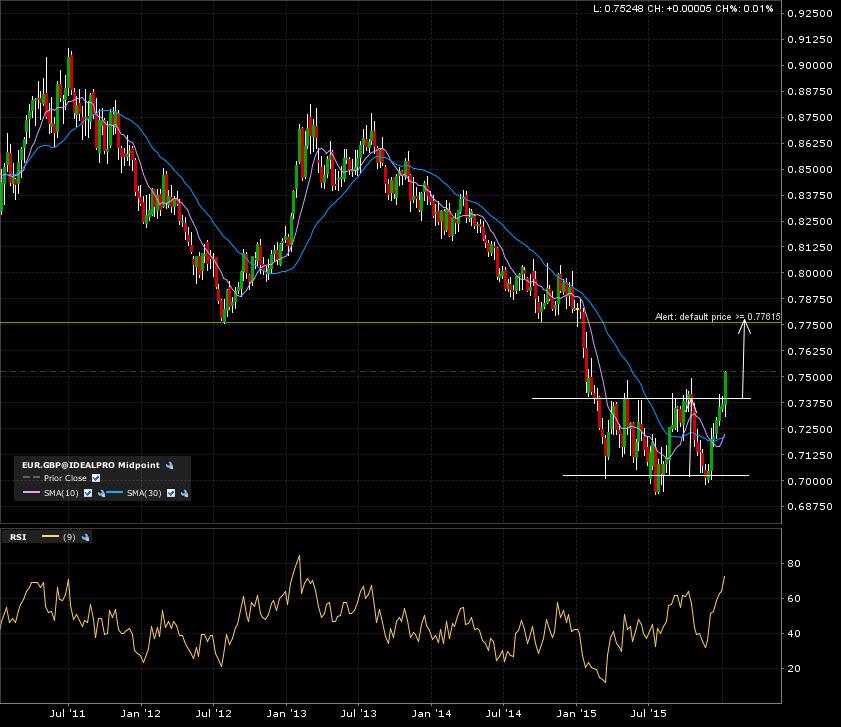
Here is the 10 year monthly candle chart. Current candle breaking out above bullsih neck line at 74.

The 5 year weekly candle chart also breaking out.
And the final zoom in on the 1 year daily candle chart.
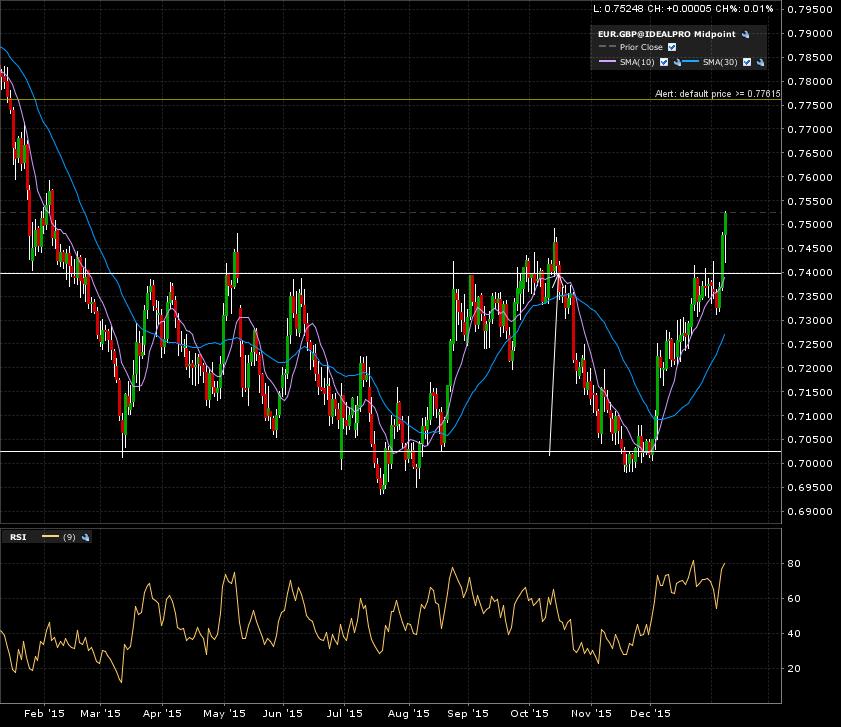
So we got breakouts cofirmed on the daily and weekly cnadle charts, Just need to wait for the monthly to confirm the 77.60 target!
Check my “How To” to get more insight on my trading philosophies.