I heard there were some takeover rumors for Blackberry? Who knows how that is going to pan out.
But there is definitely some potential in the price action of the stock.
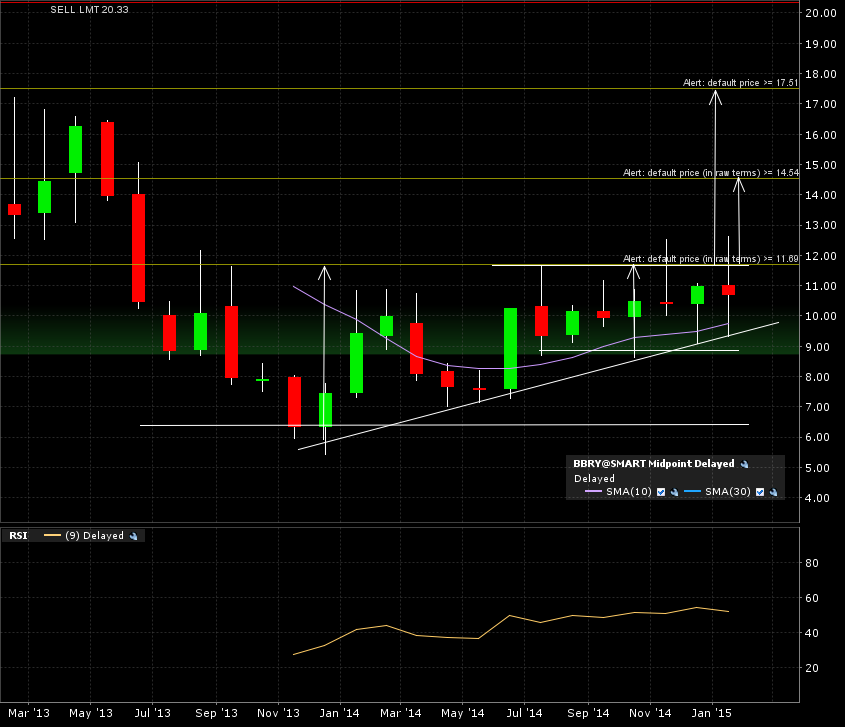
A year and a half bottom formation is well set. Check this chart school explanation of “ascending triangles”.
The implied measured move if the breakout succeeds on the monthly candle chart is 17.50.
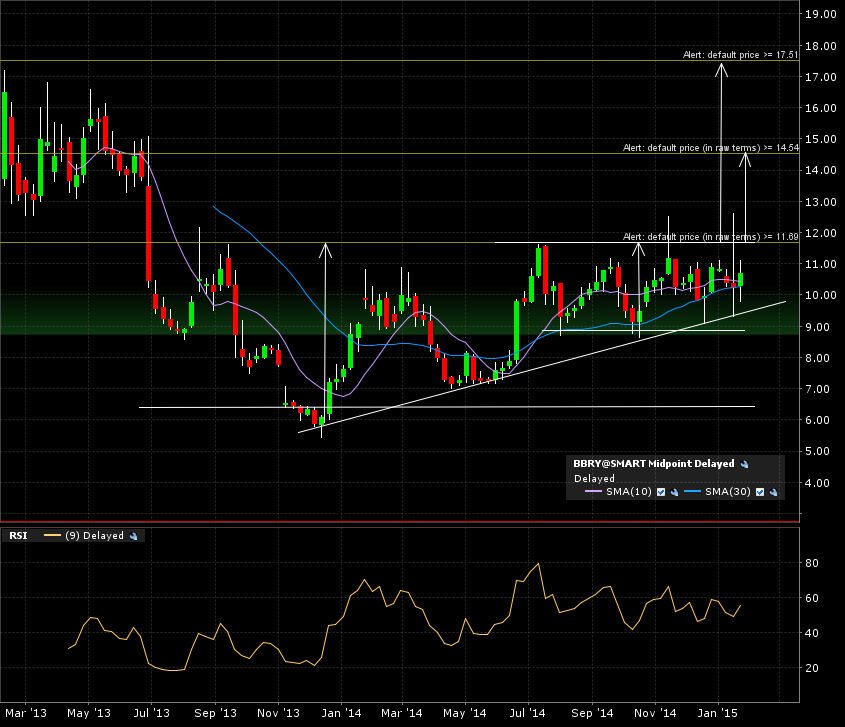
The weekly candle chart shows a smaller “take off” pattern. These patterns that coincide with a larger pattern’s breakout line will give added value to the setup. I believe this gives me a better probability that the implied measured move from the classical chart pattern will be attained.
I have a target at 14.50 for that initial play.
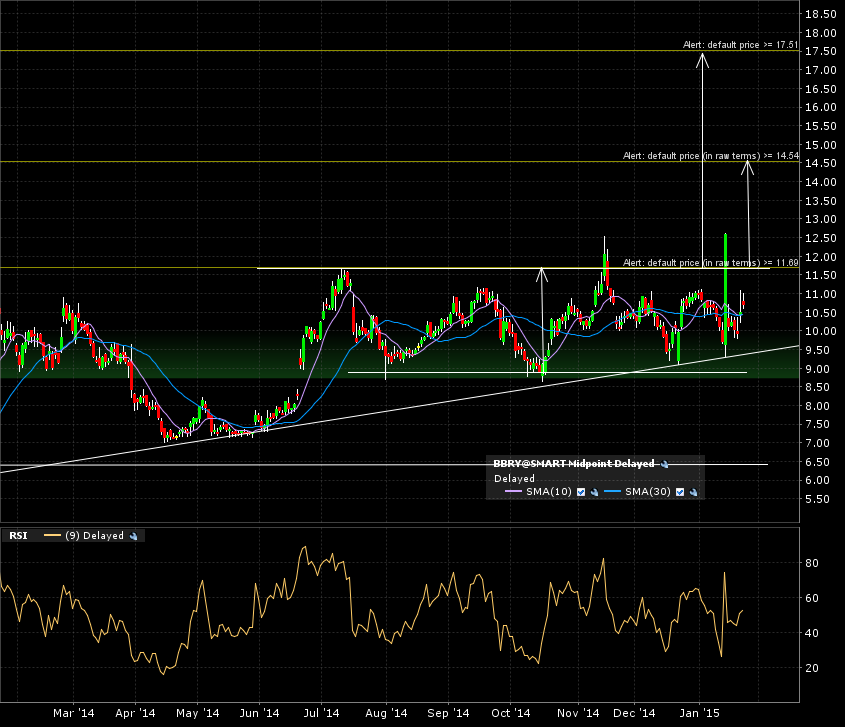
Again, to finish up, lets look at the daily action on a yearly chart.
The daily action is tricky and volatile. Much noise and false breakouts, which can be avoided if waiting for the important monthly close for entry validation.
Check out this previous post on “noise reduction”.
So my alerts are set. I’m waiting for at least a convincing weekly close above 11.70 before entering.