Well, just in my previous post about Eli Lilly and Company the makers of the popular medication Cialis, the same cup and handle classical chart pattern is present. And both setups have consolidation/continuation patterns, with Starbucks breaking out!
Check the monthly candle chart (10 years). The longer term implied measured move target is 105.
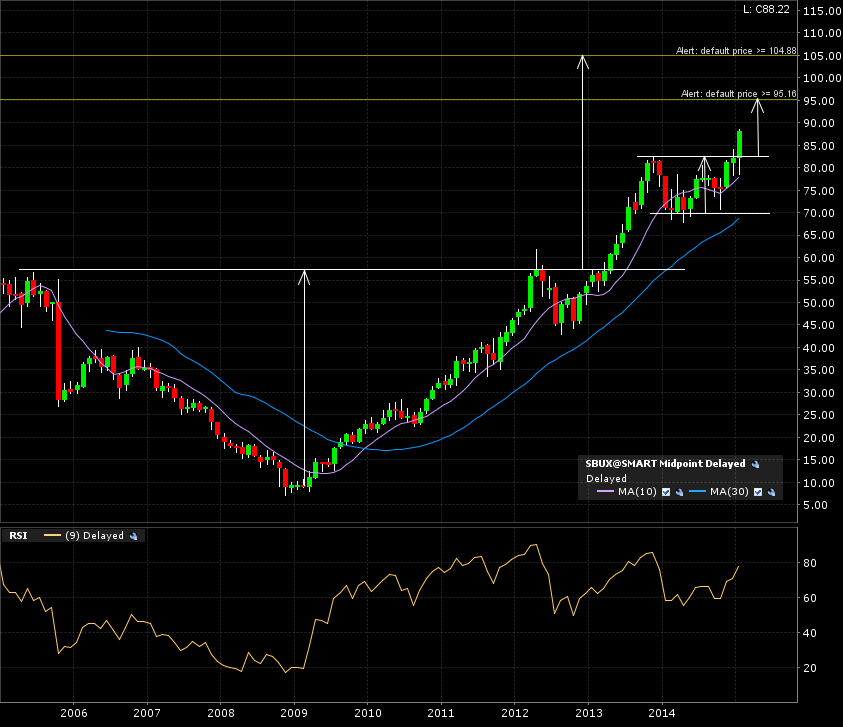
A closer view at the weekly candle chart (5 years) shows us the weekly candle close confirming the continuation pattern breakout. That pattern gives us a target of 95.

I don’t know what type of news came out this Friday, all I know is the price action reflected in the chart. Check out the daily candle 1 year chart. That is one nice break away gap.
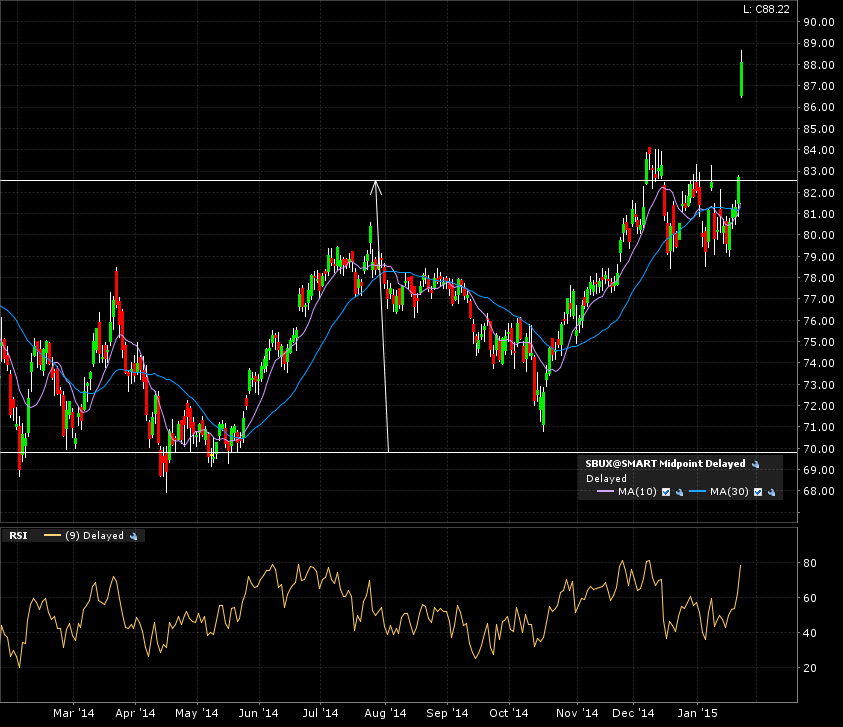
Entry at Friday’s closing price 88.22, stop loss at 79.90 and profit taker at 105, that’s a risk to reward of 1.6. Unfortunately, that is too low to comply with my risk and money management protocols.
If only I had spotted this chart back in early 2013. Good continuation for those already in!