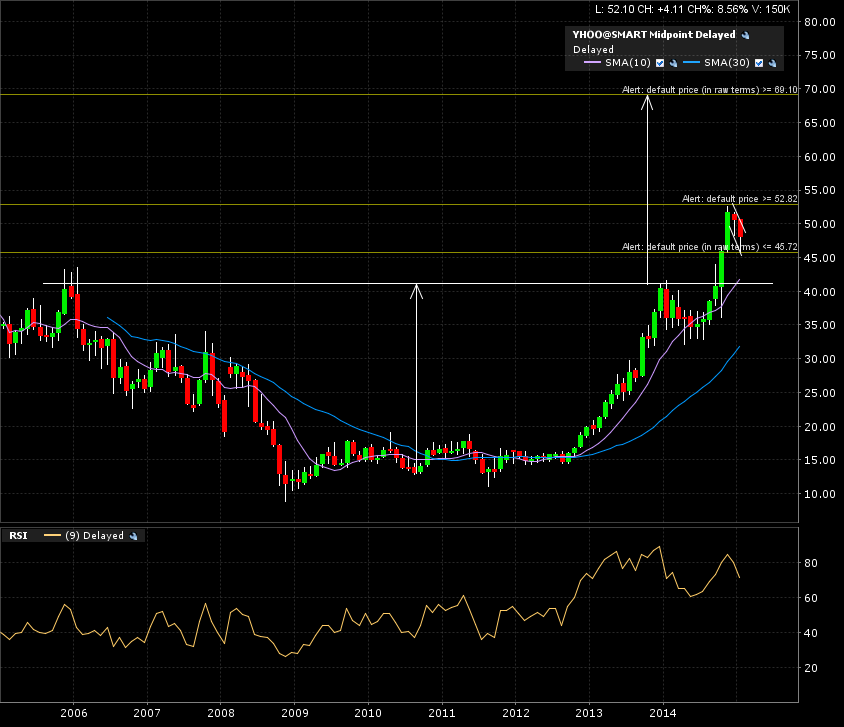
There is a huge bottom formation for Yahoo. It broke out in late 2014 after having run into resistance in late 2013.
Check out the monthly candle chart (10 years). There is (or was) a bullish continuation flag. It seems to be morphing into a descending channel.
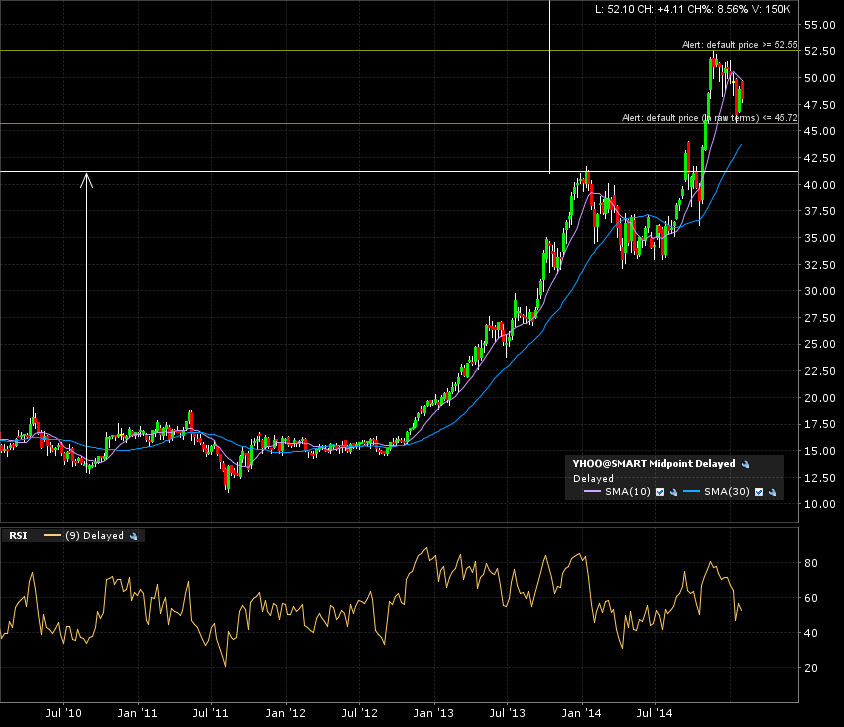
The weekly candle chart (5 years) shows the granularity of the formation.
The daily candle chart shows the 2 alerts I set up.
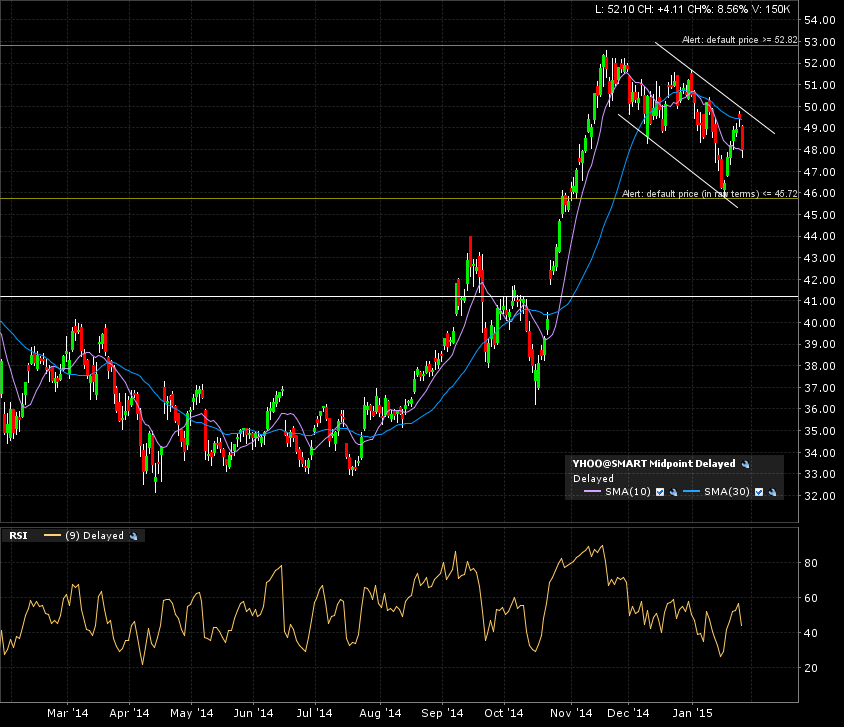
A break up north of 53 and I’m going to consider playing the bullish target of 70. A break down south below 45 and I’ll forget this stock, since I don’t see the immediate target (other than a retrace to the previous breakout line around the 41 mark).