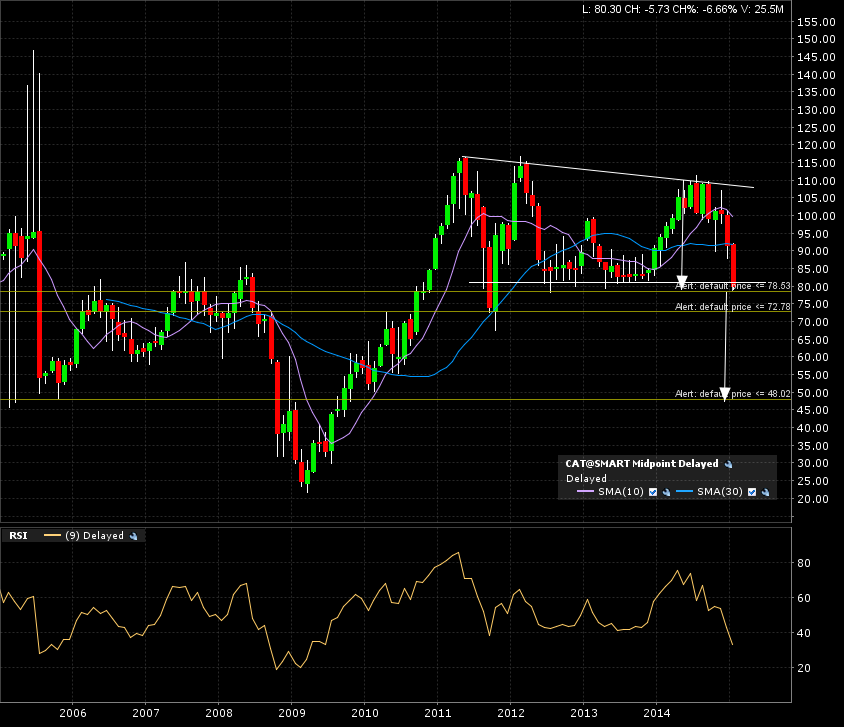
Caterpillar is testing a top formations support line (breakdown line). Check out the monthly candle chart with 10 years of data. That is a 4 year top formation. The arrows indicate the measured move and the target, if the formation is broken to the downside. Monthly candle close under 78 gives a target of 49.
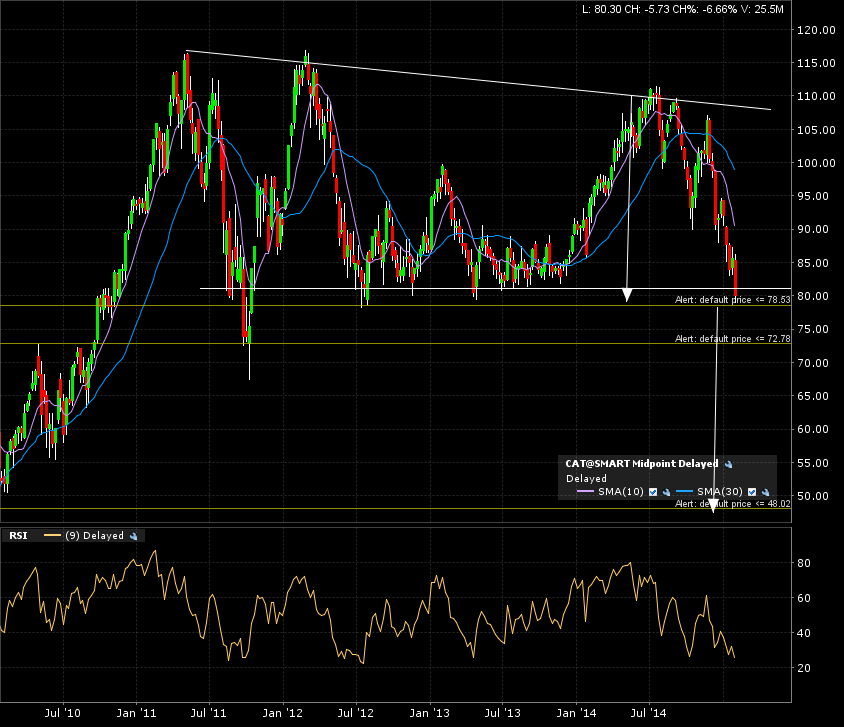
We can observe the action on the weekly candle 5 year chart. In the event of a break of support, there might be some additional support (congestion) around the 73 area.
Now the daily candle chart tells of a possible bounce off that support. A falling wedge formation is closing in on the support area. Notice the bullish divergence with the RSI? The falling wedge is usually a reversal classical chart pattern.
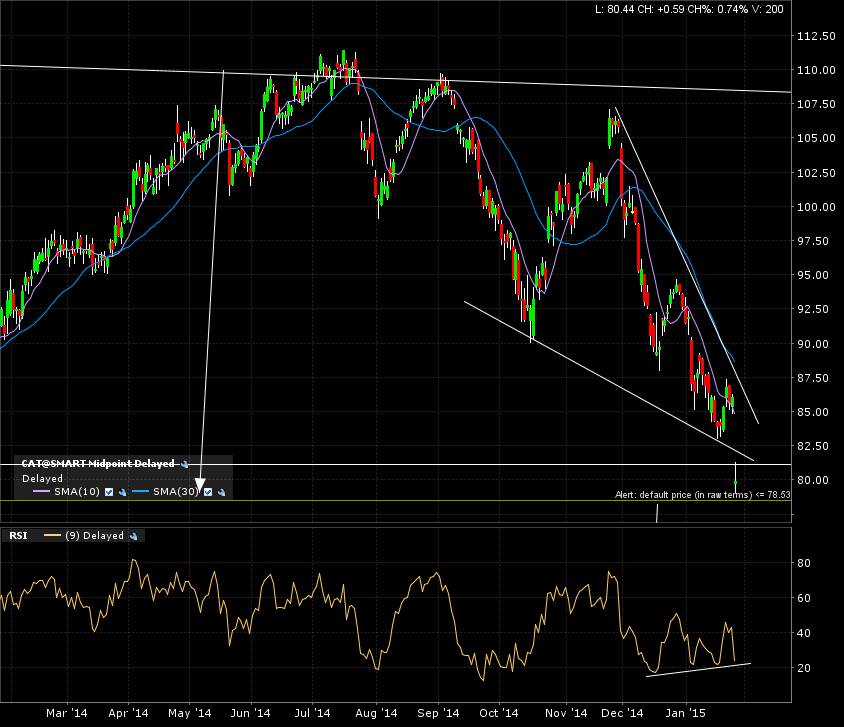
So, again I set my alert. Bounce or no bounce on the support line, I’m ready to make a move if it breaks. Caterpillar has not dug itself a hole yet, it might not even break the soil, but if it does, I’m not gonna miss it!