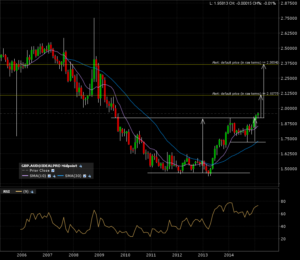
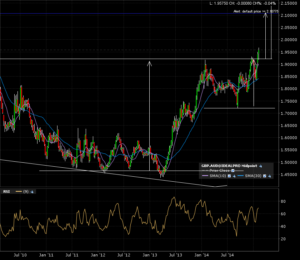
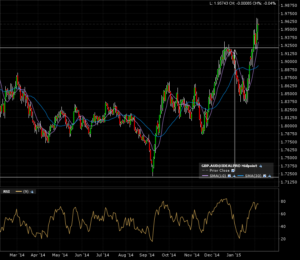
Is there more room up for the GBP versus AUD? After already a breakout of a +2 year base to attain it’s target, a new +1 year continuation rectangle (consolidation) is breaking out. This pattern is also the launching pad of a bigger base. This is A+ material.
Check the monthly candle 10 year chart and it’s arrows for the implied measured move for both the current breakout and the further target of that BIG + 5 year base.
We can see the breakout on the weekly candle 5 year chart.
The daily action on the 1 year chart is also inline with the bigger time frame charts.
I had alerts for this which got triggered recently. I’m now going to see if the risk to reward is worth the setup for the first closest target:
Pair Entry Stop-loss Profit-taker Ri:Re
gbp/aud 1.9575 1.9128 2.1000 3.19
The risk versus reward of 1:3.19 is good. The risk versus reward for the BIG move will have a much better ratio. I’m going to strongly considering entering after this weeks close.


