Not to confuse you, but there are always a possible bear AND bull breakout scenario for an ongoing classical chart pattern.
Enter Australia versus Japan. The closest breakout possible would be the bearish breakdown, but an eventual bullish scenario is also possible.
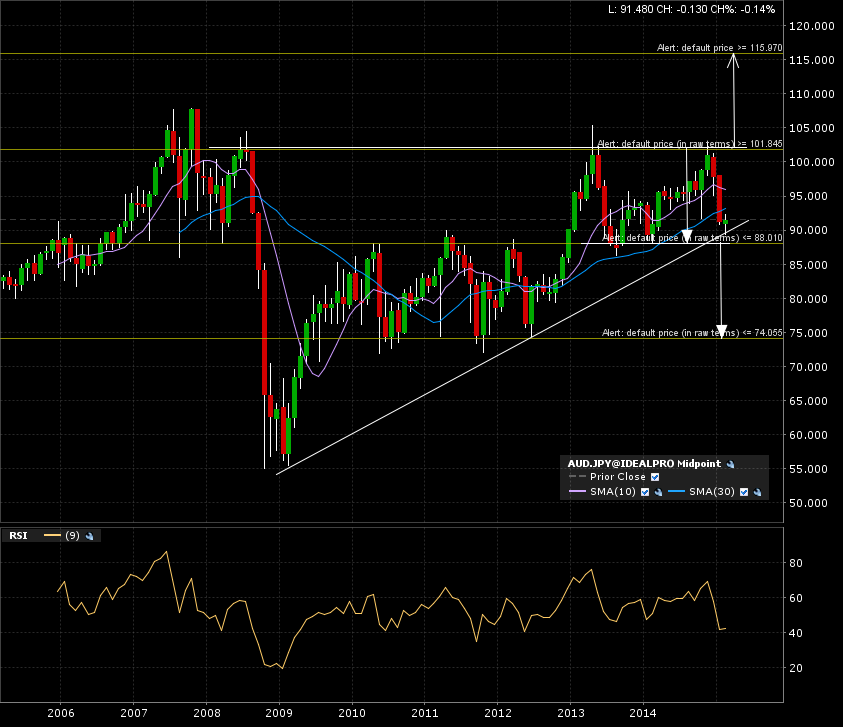
The arrows would be the implied measured move, in either case. Below is the monthly candle 10 year chart. That is a 2 year consolidation in progress.
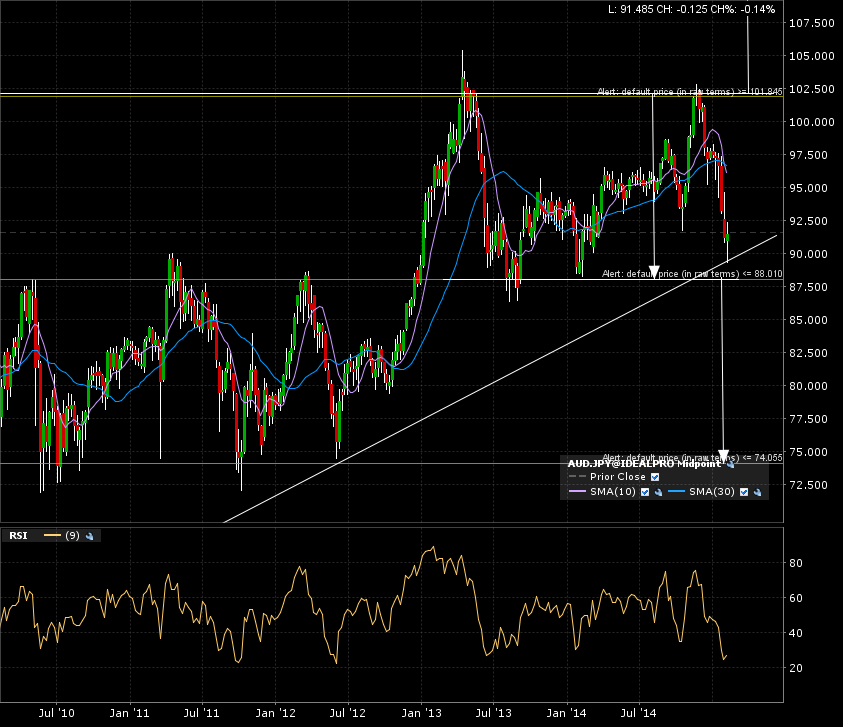
The weekly candle 5 year chart shows the levels needed to be breached.
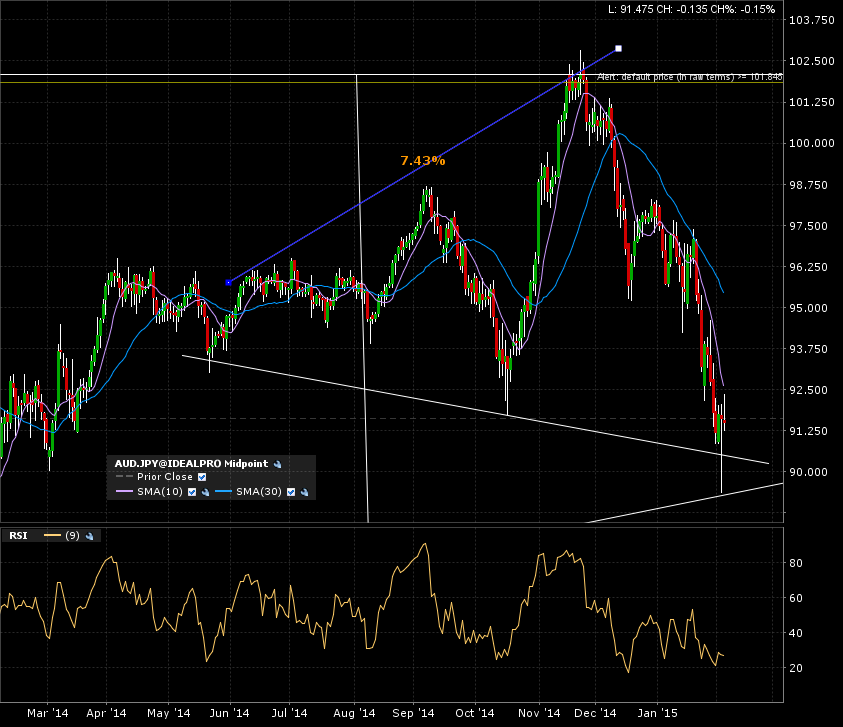
Check out the broadening top on the daily candle 1 year chart, now that is increasing volatility!
Alerts are set. Right now, keep a close eye for the bearish breakdown at the 88 mark. If not, we might just be heading back to test the upper resistance level at the 102 mark. Bearish target at 74, bullish at 116.