The ISHARES Russell 2000 ETF (ticker iwm) is ready to go fetch a higher price! Also a great example of longer and shorter term patterns that when resolved have coinciding price targets.
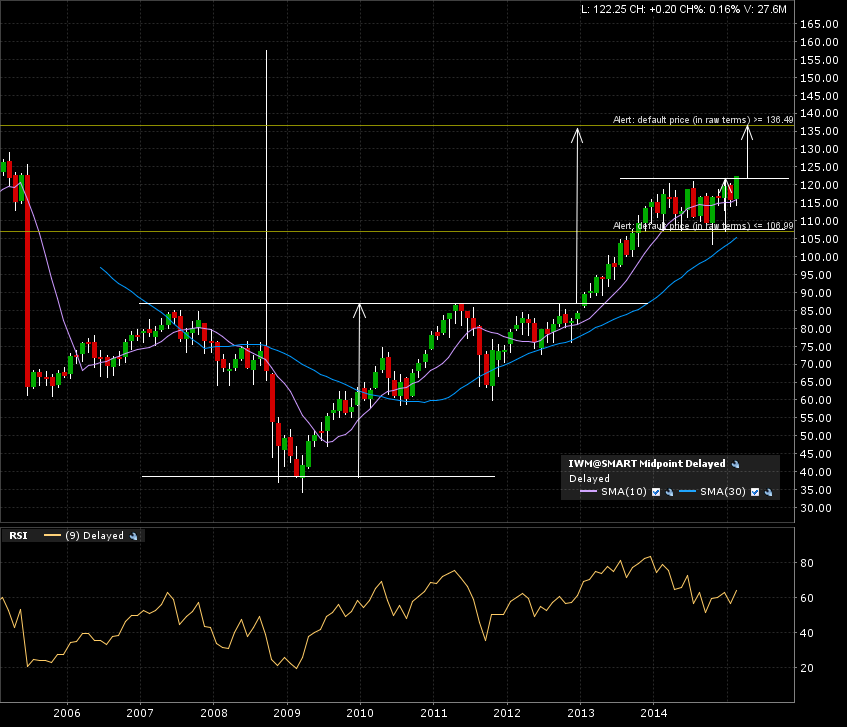
Check the monthly candle 10 year chart. A HUGE +6 year base was broken out of back in early 2013. After trending nicely towards it’s target of 136, it has consolidated in a sideways pattern for the past +1 year.
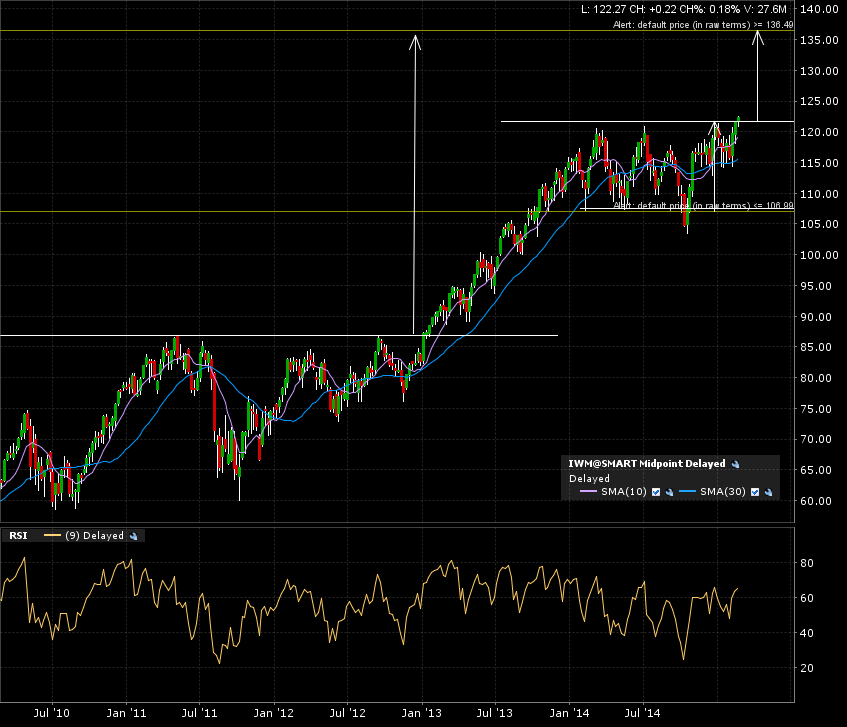
The weekly candle 5 year chart shows us the current breaking out of the consolidation pattern. Both targets of the longer term base and this recent pattern coincide at the 136 level. This synergy yields added value to the setup.
Zoom in on the daily candle 1 year chart. Clear break in progress above the breakout line.
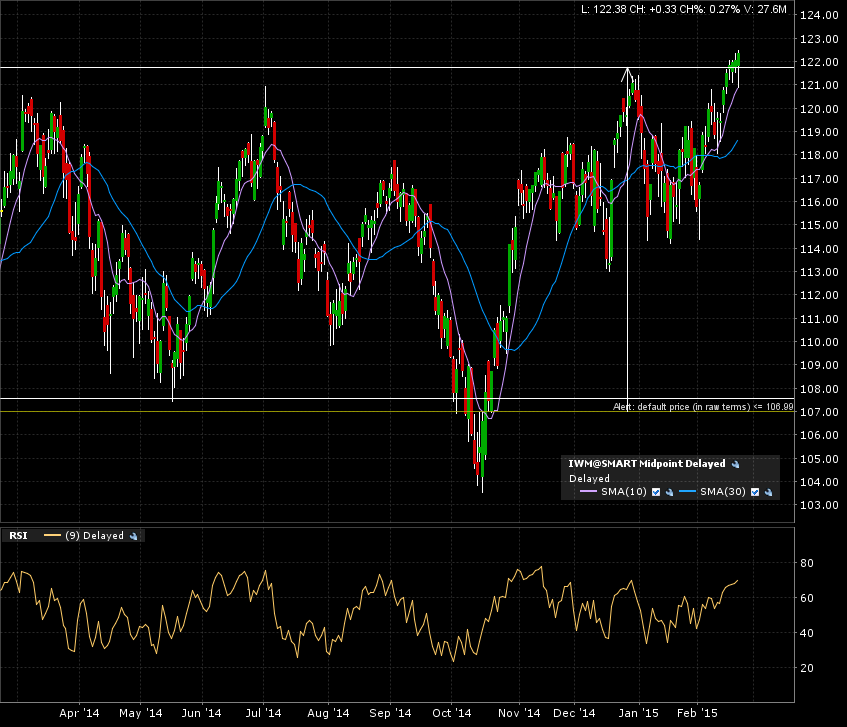
IF we get a monthly candle close above the 122 breakout line, the move is confirmed with 136 as the target. An A+ setup.