Checking in on the Euro versus Aussie currency pair. Right now, seems to be in the middle of a consolidation pattern.
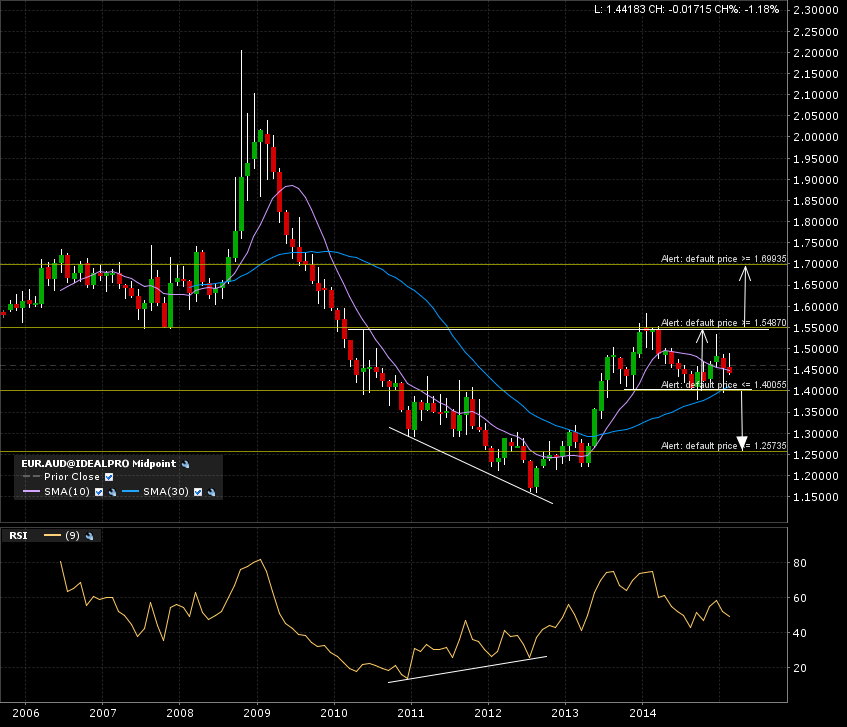
Here is the 10 year monthly candle chart. Two scenarios possible.
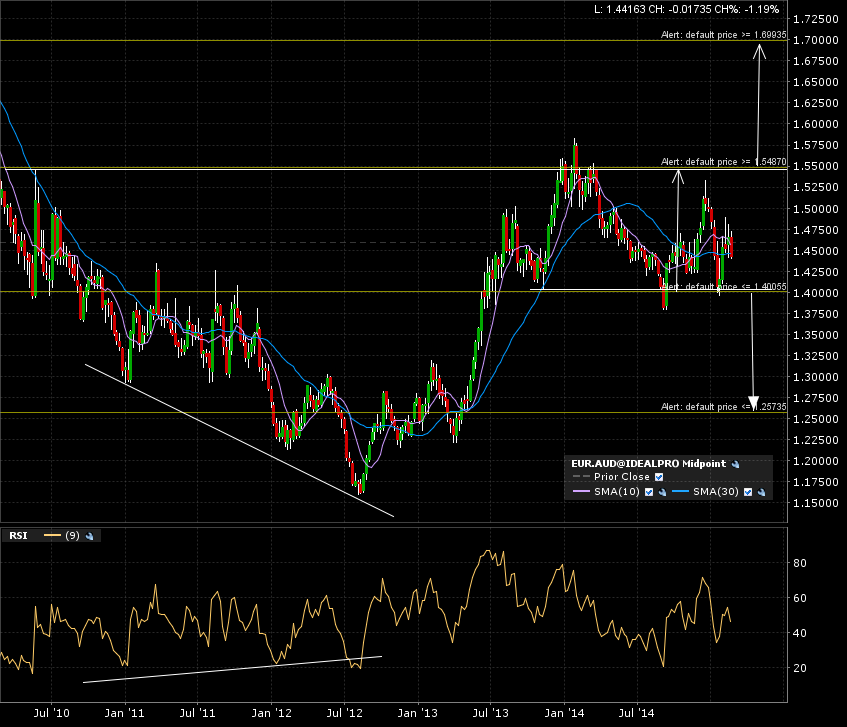
We can see on the weekly candle 5 year chart the levels I’m looking at for either bullish or bearish case. The arrows indicate the implied measured moved added to the breakout line.
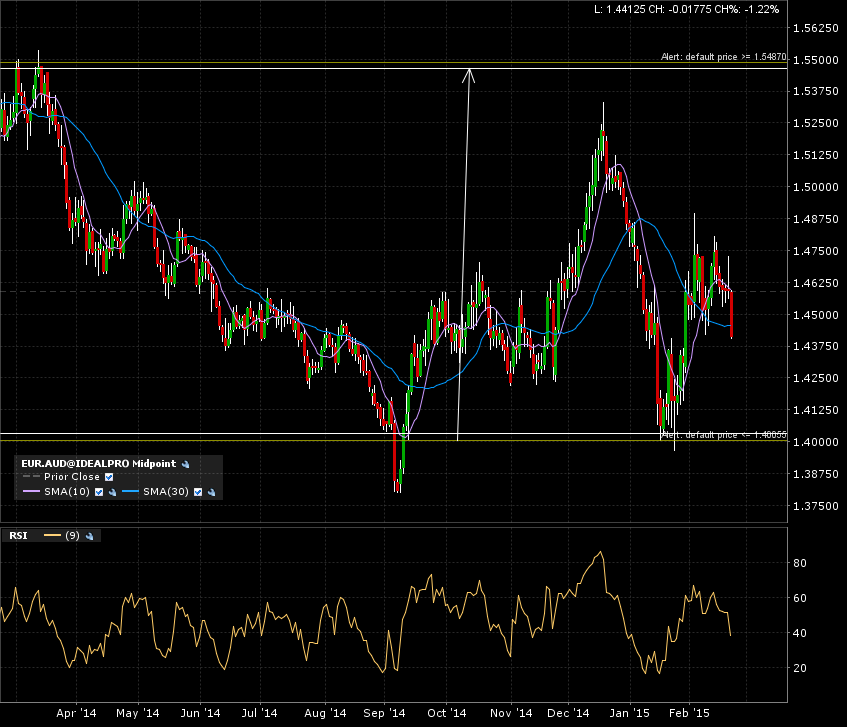
Zooming in on the daily candle 1 year chart, the pair is pretty much in no man’s land. Maybe heading to test the support, but remember lot’s of noise on the daily candle chart compared to the monthly candle chart.
I set some alerts. The 1.55 breakout level for the bullish case to the 1.70 target. The 1.40 breakdown level for the bearish case to the 1.25 mark.
Again, a monthly candle close break required to confirm move and get the added value for the setup.