Peeking at xagusd, or silver expressed in usd. The monthly candle chart (+4 years) shows the price action for the past +3 years is in a descending channel.
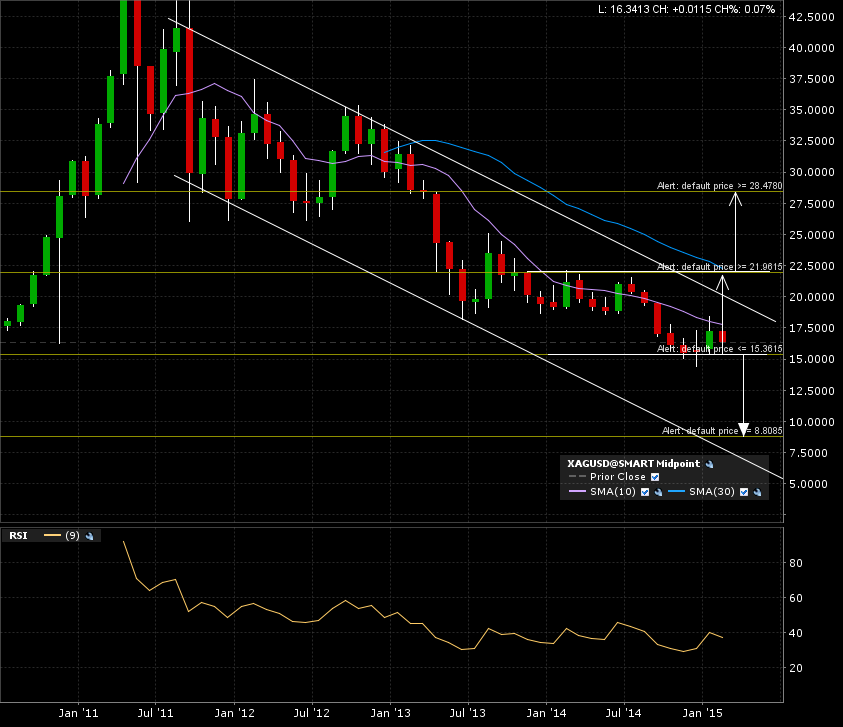
The weekly candle chart has nearby support and resistance identified. IF broken, the implied measured move is added to the breakout line.

The 1 year daily candle chart shows some recent test of the support line. Another test of that support line is approaching.
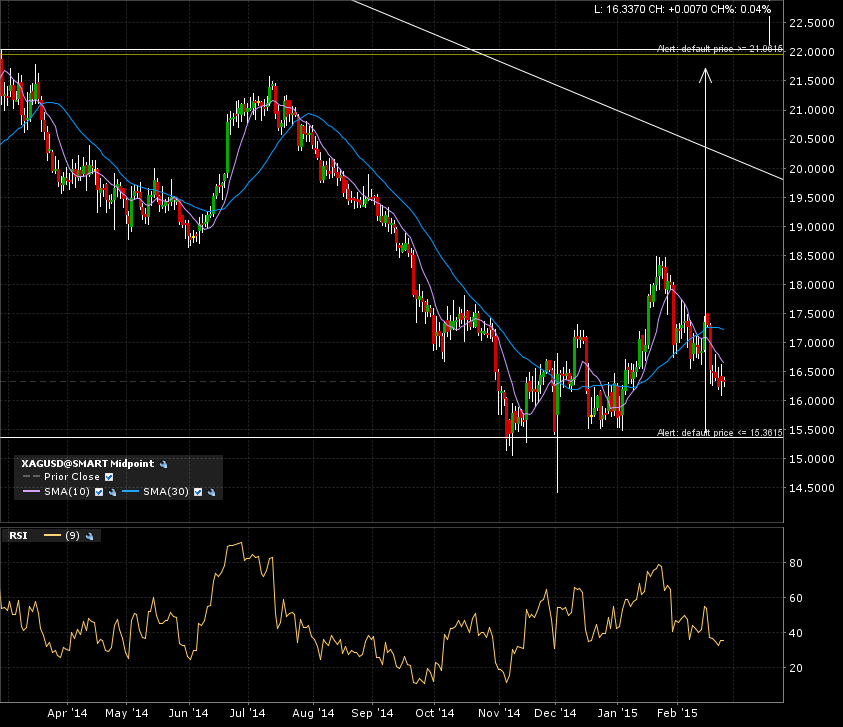
My alerts are set.
When triggered, I’ll come back to this chart and re evaluate. Right now, there are two possible scenarios: 1- Bullish case is a monthly candle close above 22. The target would be 29. 2- Bearish case is a monthly candle close below 15. The target would be 8.
The peek is now over, the waiting game begins!