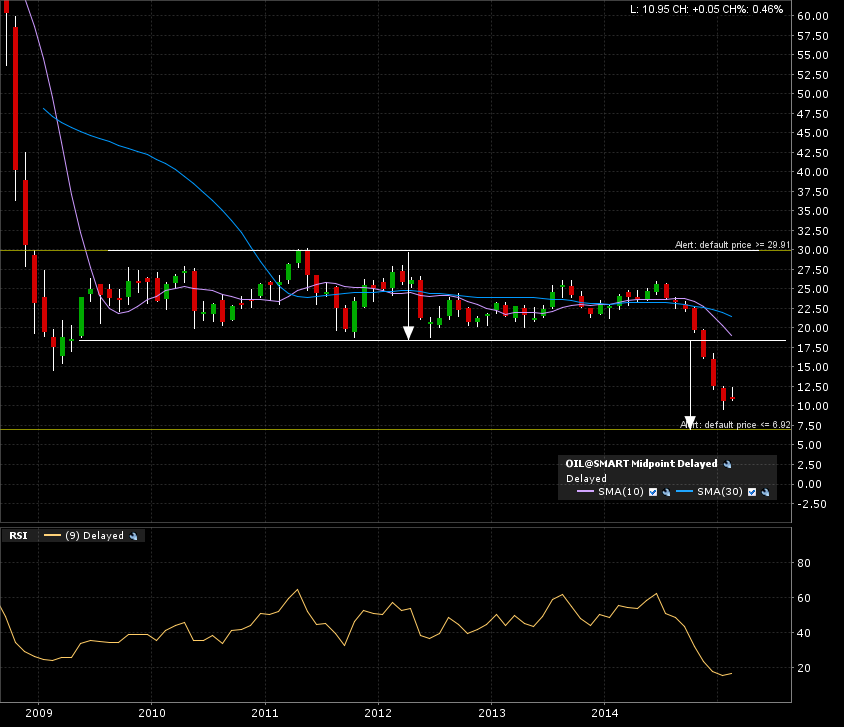
Here is the IPATH S&P GSCI CRUDE OIL monthly candle +6 year chart.
Since the HUGE +6 year consolidation rectangle was broken in late 2014, the price action has been slipping along towards the implied measured move target at 7.
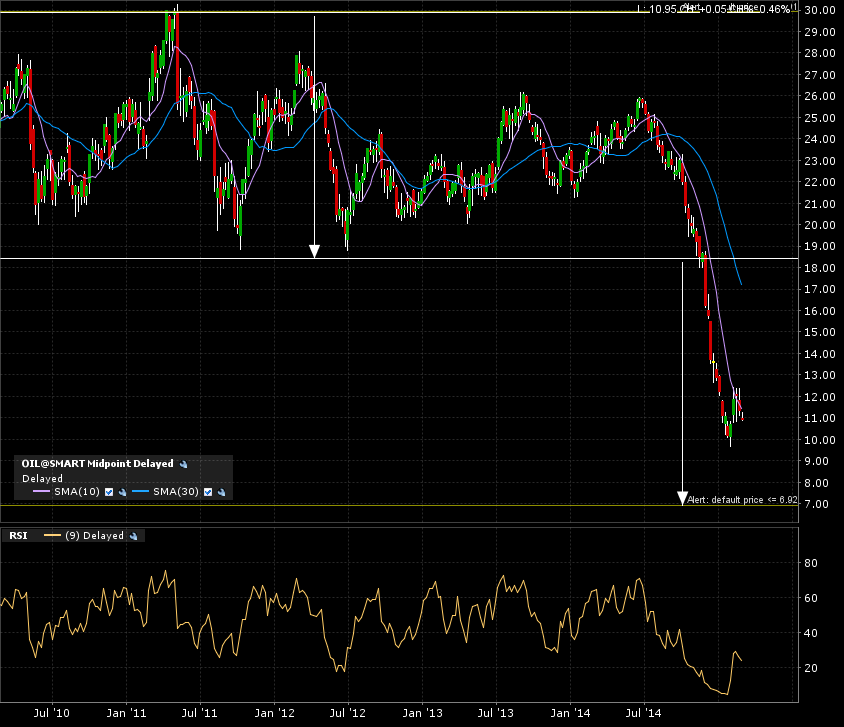
The weekly candle 5 year chart show the rapid fall after the breakdown. A small consolidation is in progress.
The zoom in on the daily candle 1 year chart shows the remain of the bearish move need to reach the target.

Right now, there is no play. If you are already in, then the target is still valid. I’ll come back to this chart once my alert is triggered at the target.