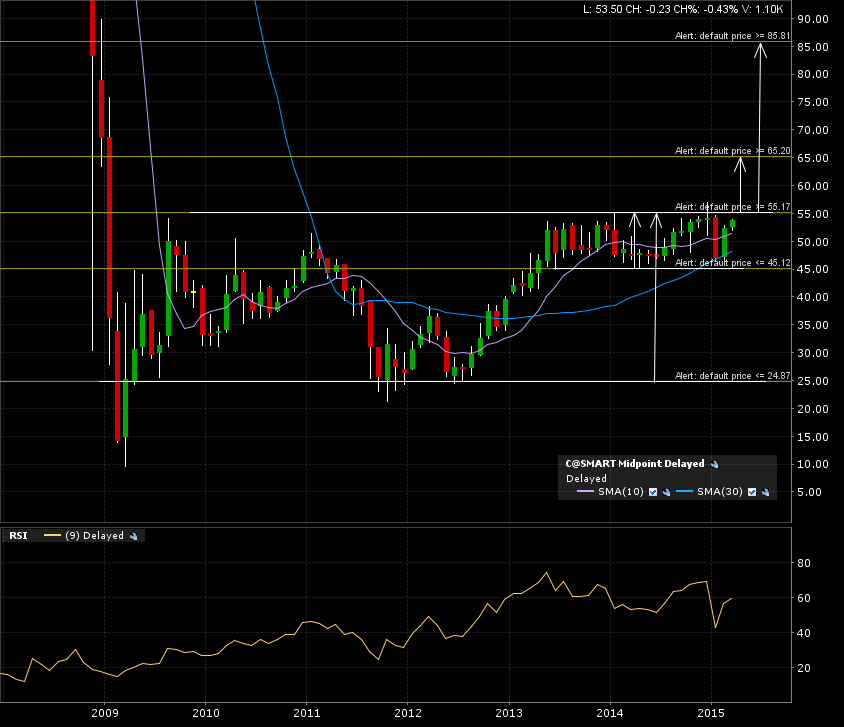
Citigroup Inc. is aiming to get back in big boy area. After a fall from heaven back in late 2007, it has been consolidating for the past +6 years in a HUGE base formation. There is also a +1 year launching formation for that larger formation on the coinciding breakout line at 55. I believe this adds value to the setup.
Check the monthly candle chart. The arrows are the implied measured moves added to the breakout line.
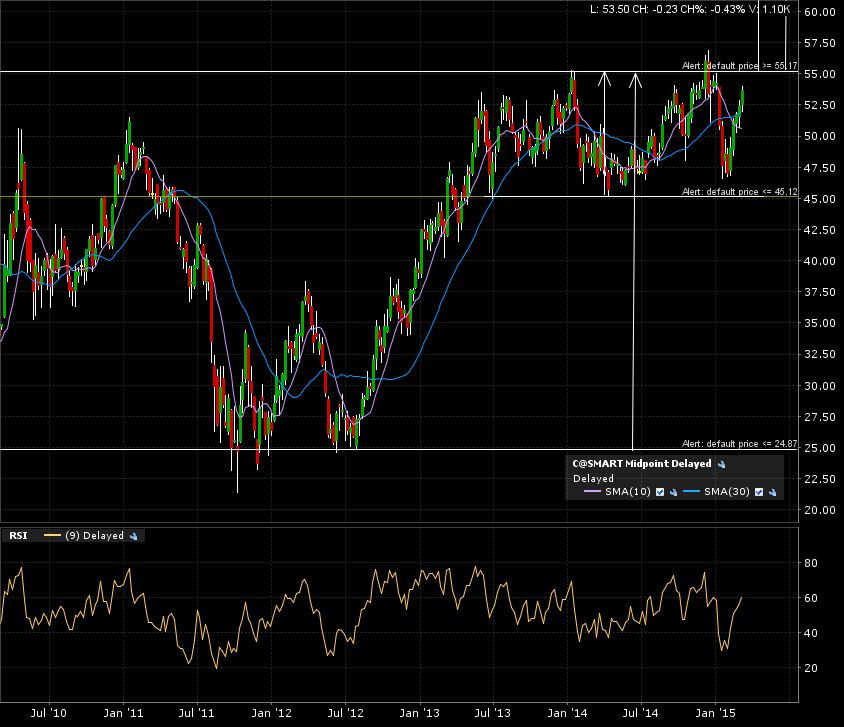
Here is the weekly candle 5 year chart. The breakout line has been tested a few times in the past year. The more times a resistance line tested, IF a breakout occurs, the stronger out the gates the move will be.
Zoom in on the 1 year daily candle chart. The price action is a few days way from testing the breakout line (resistance).

My alerts are set. I’m looking for a monthly candle close above the 55 level to confirm the breakouts. Two targets would ensue, the closet being 65, then 85. Again, this is an A+ setup.
Remember to see my “How To” for an understanding of my charting approach and risk and money management protocols.