Wow. After a breakout in early 2011 around the 30 level, cvlt might be on a reset trip back to that level after hitting highs 3x as much.
Here is the 8 year monthly candle chart. First top formation has hit it’s target.
Now a descending triangle (continuation) classical chart pattern is in the works.
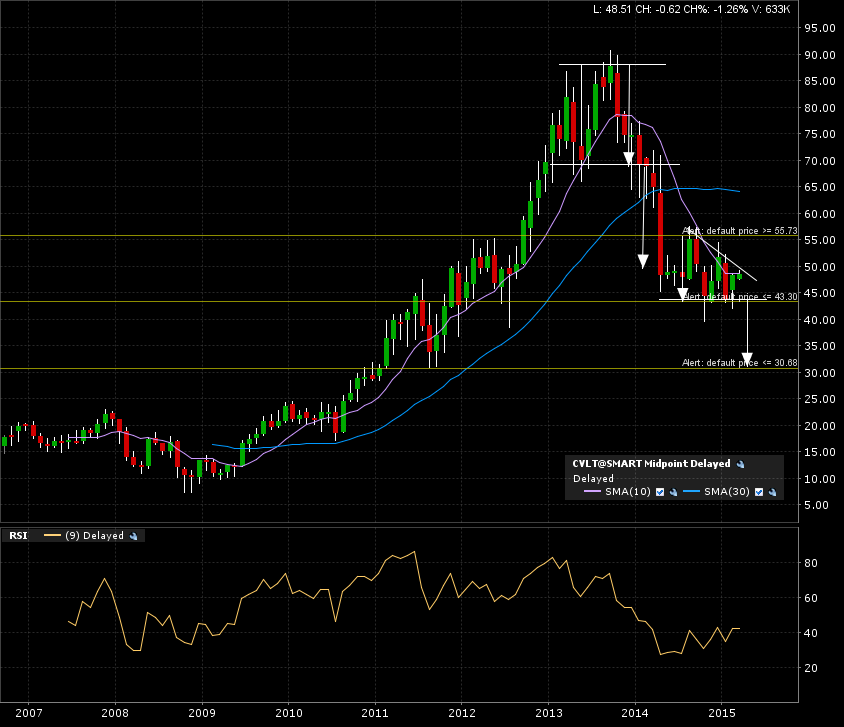
Here is the price action on the 5 year weekly candle chart. I set an alert around the 43 breakdown level.

Zoom in on the 1 year daily candle chart. Approaching a test of the upper boundary at the 50 level. Further more, a break above 55 invalidates this bearish scenario.

My alerts are set. A monthly candle close below the 43 mark gives an implied measured move target of 30.
That’s one helluva reset button somebody pressed!