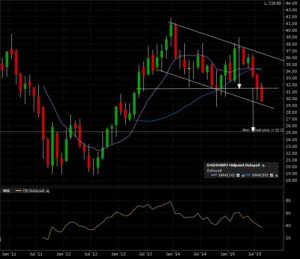
General Motors Company (GM:NYSE) is testing the lower boundaries of it’s morphed descending channel. Check this previous post I wrote Feb 11. GM never had a monthly candle close above 38. Now we are back below the breakdown line of 31.50. Check out the monthly candle chart.
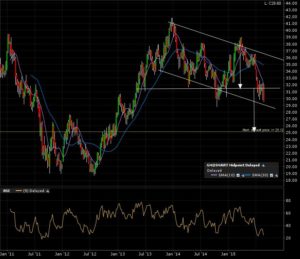
Here is the weekly candle chart. Some support around the 30 level. If the monthly candle close is below that levell, the target is 25.
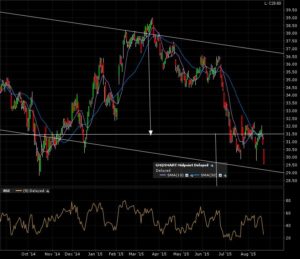
The 1 year daily candle cart shows the price action testing the descending channel’s low support line.
I’m going to come back to this September 1st. What a few months can do in terms of chart morphing (check this post on chart morphing). From a possible bullish breakout to a possible bearish breakdown!


