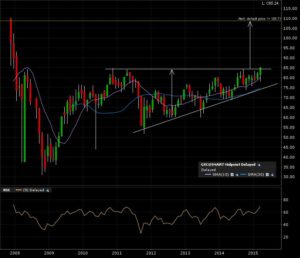
SPDR S&P China ETF is on the verge of a confirmed breakout. Need a monthly close above 84 to confirm the implied measured move added to the breakout line (resistance). Target 108. Here is the monthly candle chart.
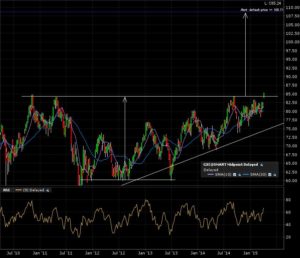
The weekly candle chart shows this week’s gap up above the breakout line.
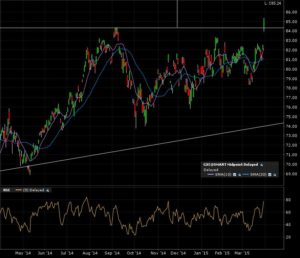
Zoom in on the 1 year daily candle chart and the price action shows the clear try for that breakout.
The current month is almost closed. Will come back to this chart tomorrow and see if the close is still convincing above the 84 mark.


