This is my third post on Blackberry (BBRY:NASDAQ). Click here to see the first, and here for the second. We never got the confirmed breakout above 11.70. The charts are morphing over time. Here is the updated analysis.
The monthly candle chart is now a consolidation rectangle. 2 scenarios exist, but we are closer to the bearish one as of today.
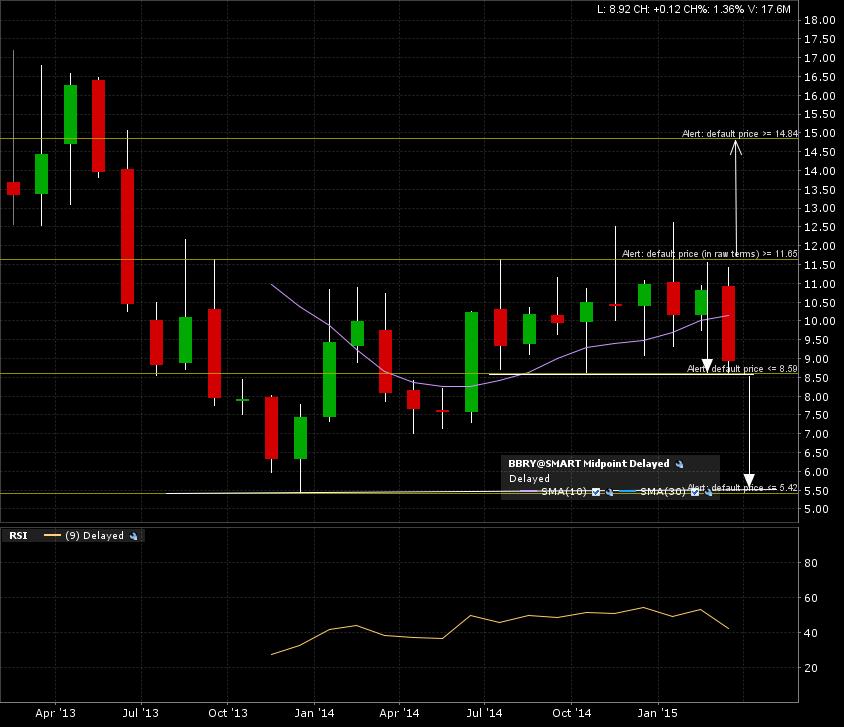
The weekly candle chart shows the price action testing the support line.

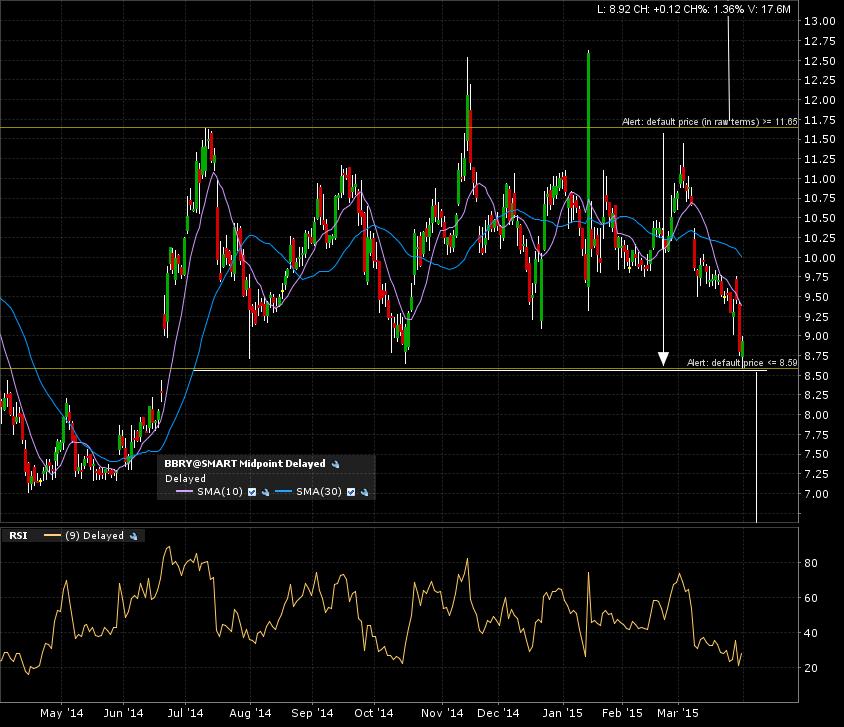
Zoom in on the 1 year daily candle chart. Same as the weekly. Closing in on a breakdown.
I have updated my alerts for both scenarios. Will come back to this once one of them is triggered and see if I can get a monthly candle close below the breakout OR breakdown line to confirm the next target.