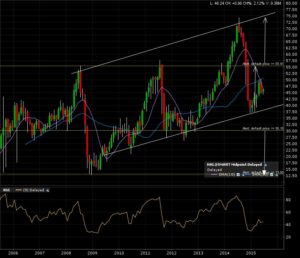
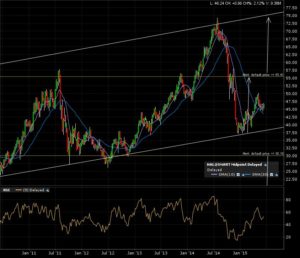
Halliburton Company (HAL:NYSE) is in a HUGE +7 years ascending channel. I have laid out the 2 possible scenarios.
The 5 year weekly candle chart shows the recent test of the lower boundary (support).
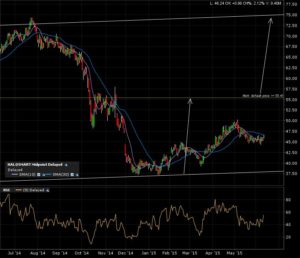
Zoom in on the 1 year daily candle chart. Price action below the breakout line within the ascending channel pattern. A break above 55 will give a target at the upper boundary of the channel, hence 75.
I have my alerts set and will come back to this after one triggers.


