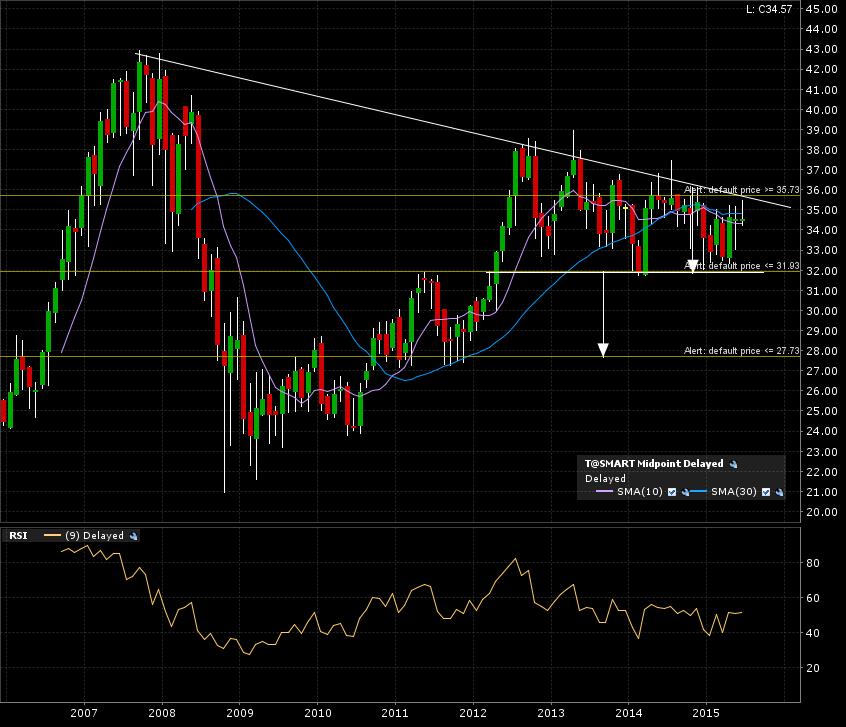
AT&T, Inc. is in progress of carving out a BIG +3 year top. Here is the 10 year monthly candle chart.
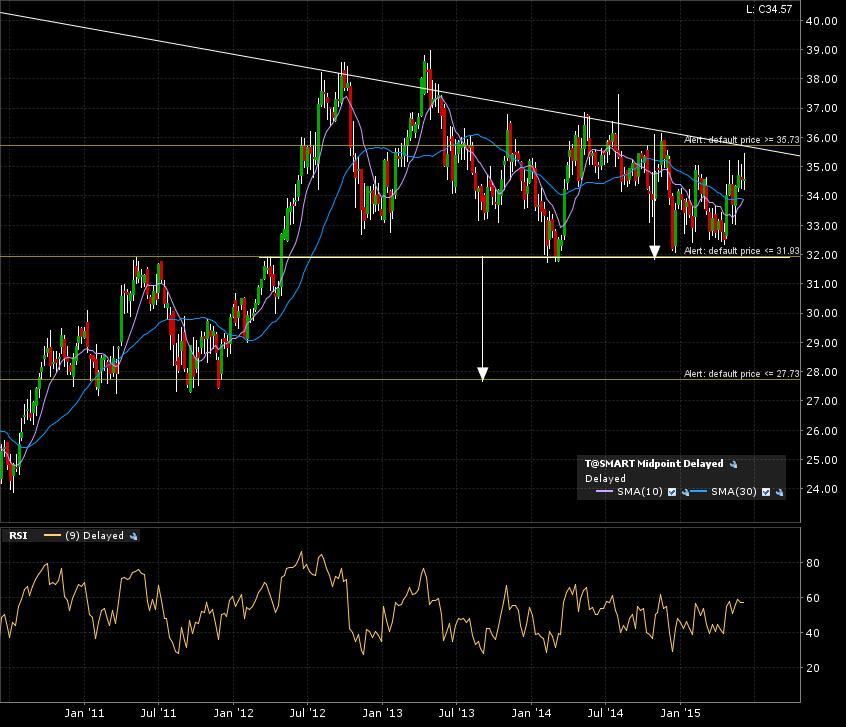
The 5 year weekly candle chart shows a test coming up of the descending trend line.
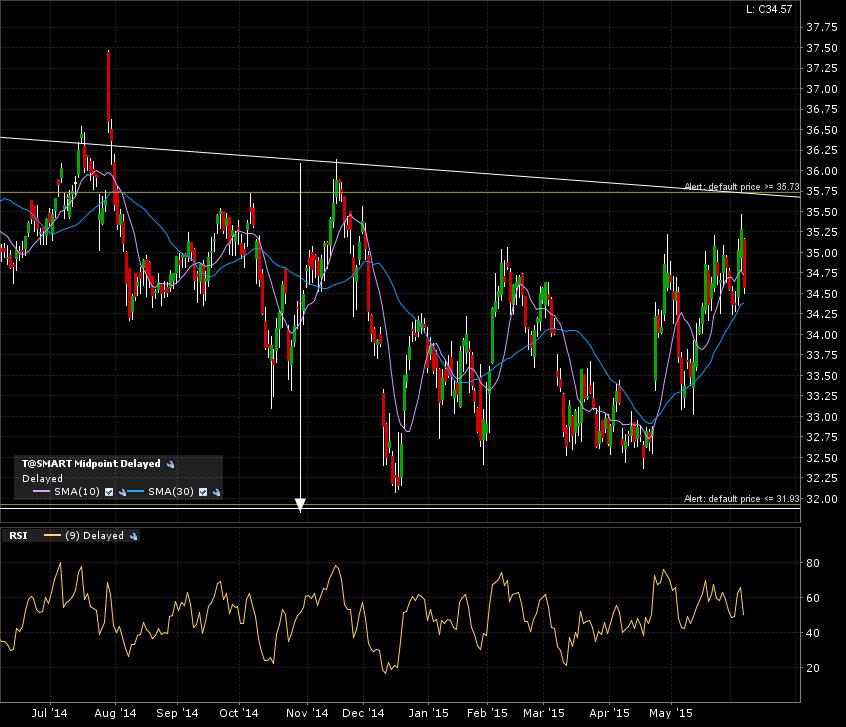
Zoom in on the 1 year daily candle chart shows the price action approaching the resistance line.
My alerts are set. The bearish break down scenario will be confirmed after a monthly candle close below 32. The ensuing target would be an implied measured move to the 28 mark. This also coincides with a WALL. Check this previous post about this important concept.