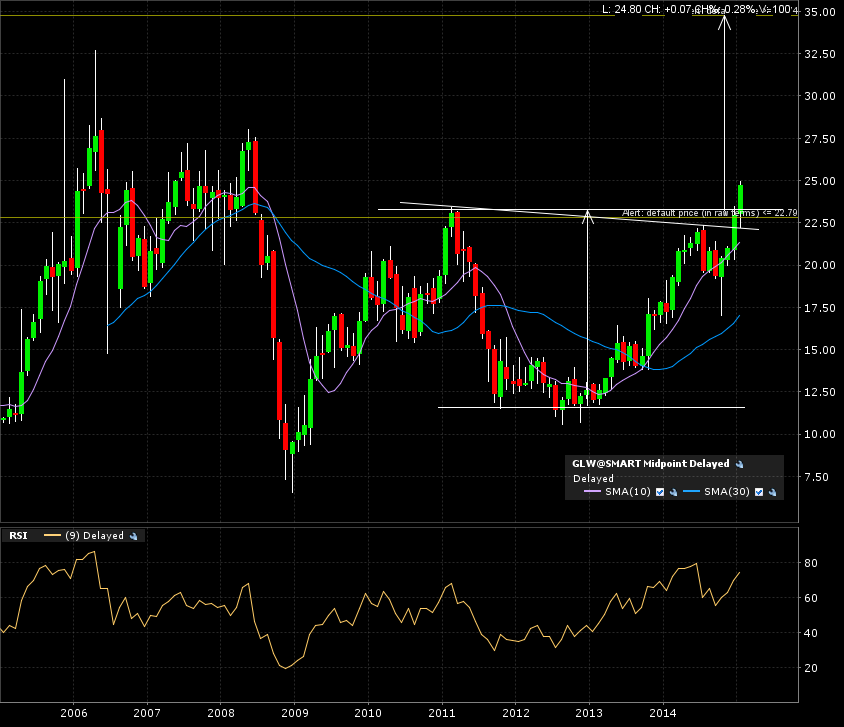
Breaking out after a retrace from a previous failed attempt at breaking the resistance line. Check the monthly candle chart with 10 years of data. The arrow is the measured move added to the horizontal breakout line.
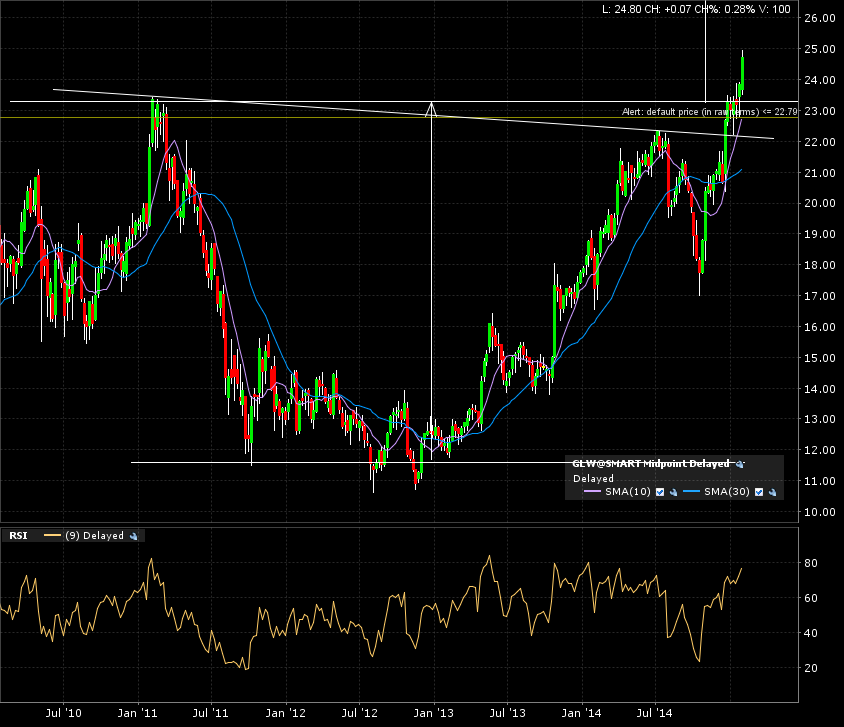
Weekly candle chart (5 years) shows the weekly break from that huge bottom formation.
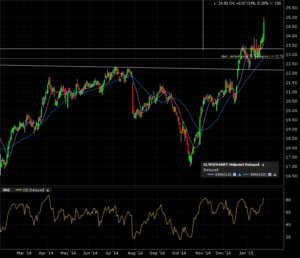
The daily candle chart (1 year) details the move out of resistance area. Check out the breakaway gap.
If the current monthly candle can close above the breakout line, it’s a go with target at the 35 mark. Note, watch out for some turbulence around the 28 mark (previous resistance).