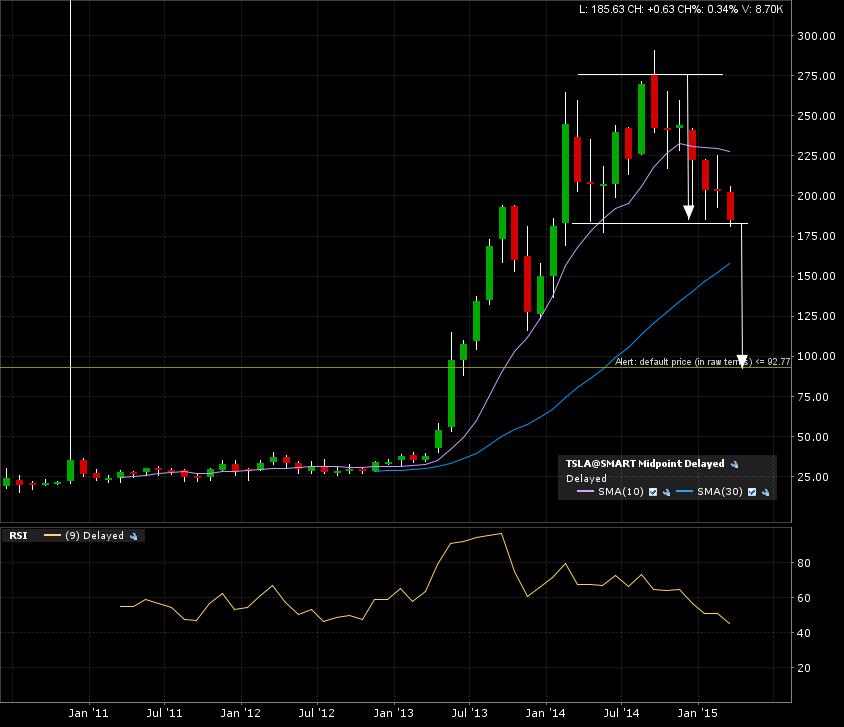
A +1 year top is being formed and on verge of breakdown for Tesla (TSLA:NASDAQ). Here is the monthly candle chart.
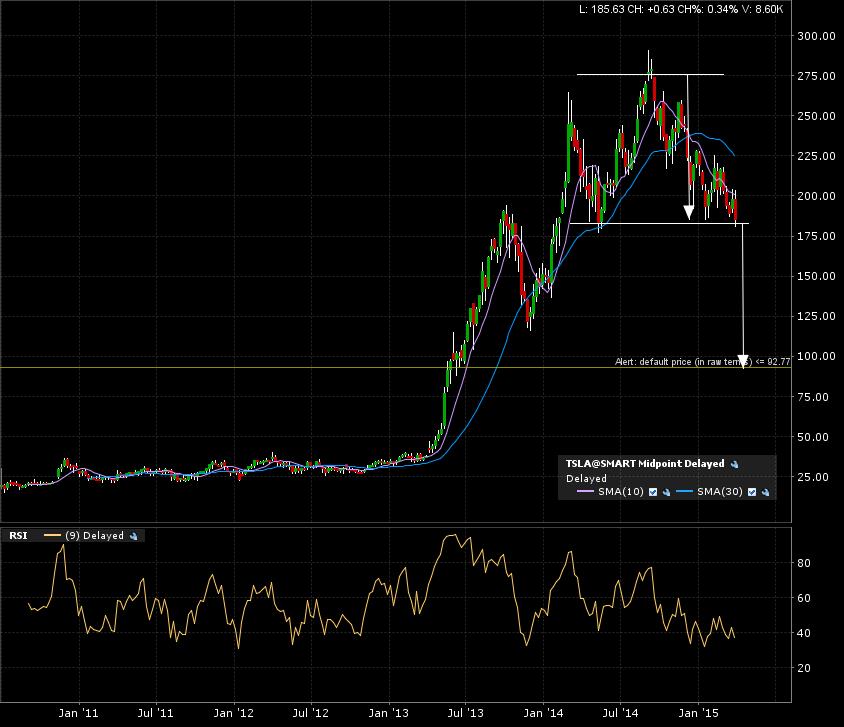
The weekly candle chart shows the multiple tests of the breakdown line (resistance) at 180.
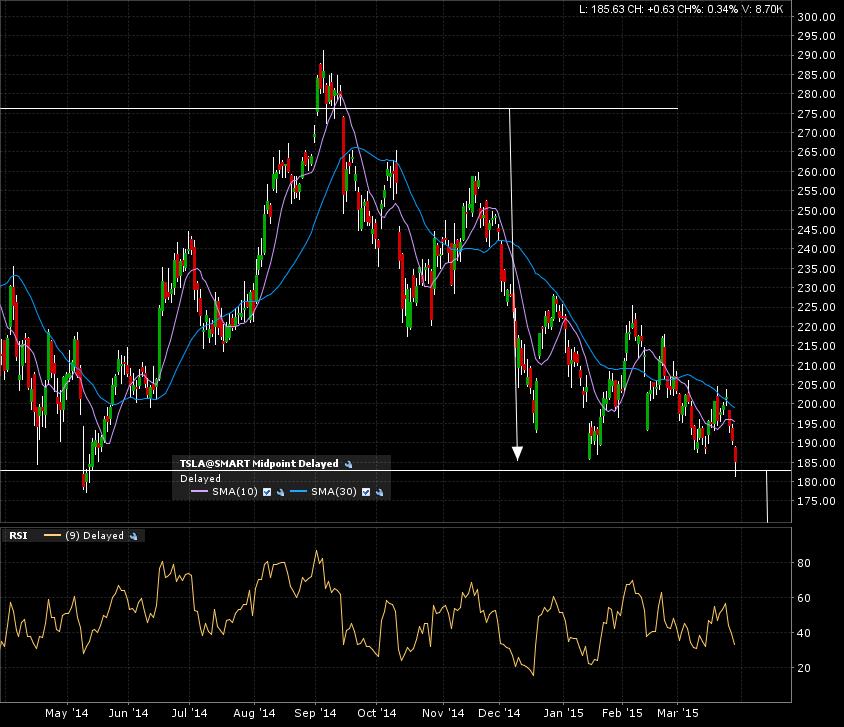
Zoom in on the price action with the 1 year daily candle chart. Closing in…
I have an implied measured move in case of monthly close below 180 giving a target of 95. There is a possible WALL at 125. Exit possible at that mark.