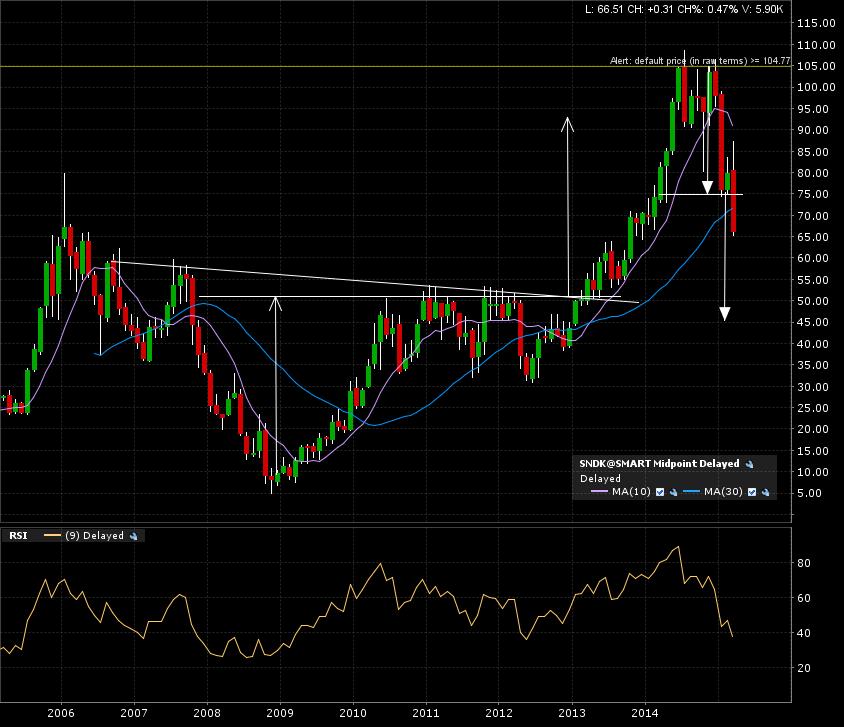
SanDisk (SNDK:NASDAQ) had a good run after breaking out of that HUGE 6 year base back in early 2013. A year and a half later, it reached it’s target. Patience does pay off! After some consolidation, a top formation is formed and now breaking down. Here is the 10 year monthly candle chart.
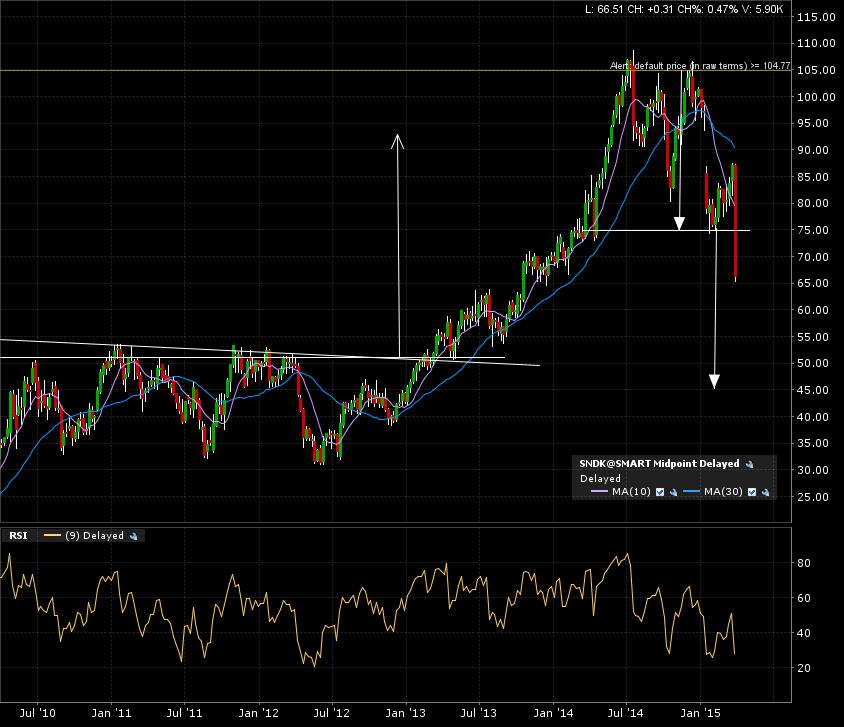
The 5 year weekly candle chart show the candle breaking down below the support line.
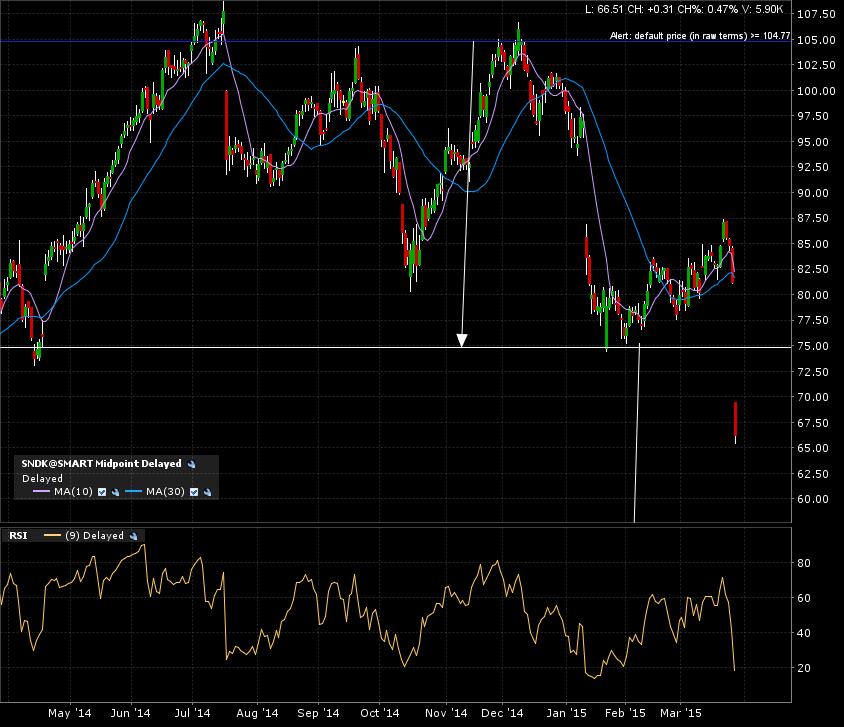
The 1 year daily candle chart shows the price action with a gap down below the support line of 75.
If the current monthly candle can close below the breakdown line, I have a target of 45 for SanDisk.
There is previous heavy resistance turned support (previous breakout line) at the 50 mark. This could end up being a WALL, exit possible at that mark also.