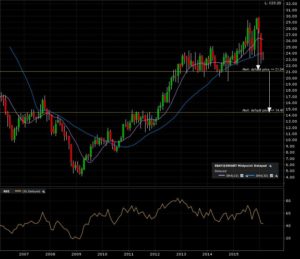
Ebay (EBAY:NASDAQ) is carving out a BIG +3 years top formation. The lines are drawn. A monthly close below 21 gives a target 1t 14.50, a previous breakout line and now a “WALL”. Check this previous post on EBAY here and this post on my concept of “WALLS” here. Here is the 10 year monthly candle chart.
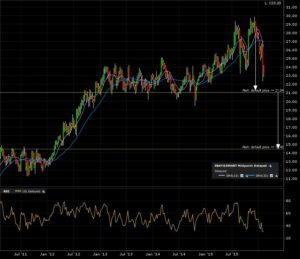
More of the same on the 5 year weekly candle chart.
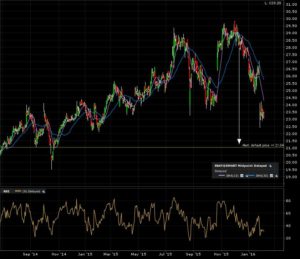
Price action closing in on the breakdown line on the daily chart.
Just need to wait for the monthly candle close below the breakdown line and ride this to target!


