On Jan. 15th I wrote a post on the after effect of the eurchf peg lift. Check it out here. Time has passed and the charts haved morphed. Pressure is still bearish on the audchf pair. Check out the monthly candle chart.
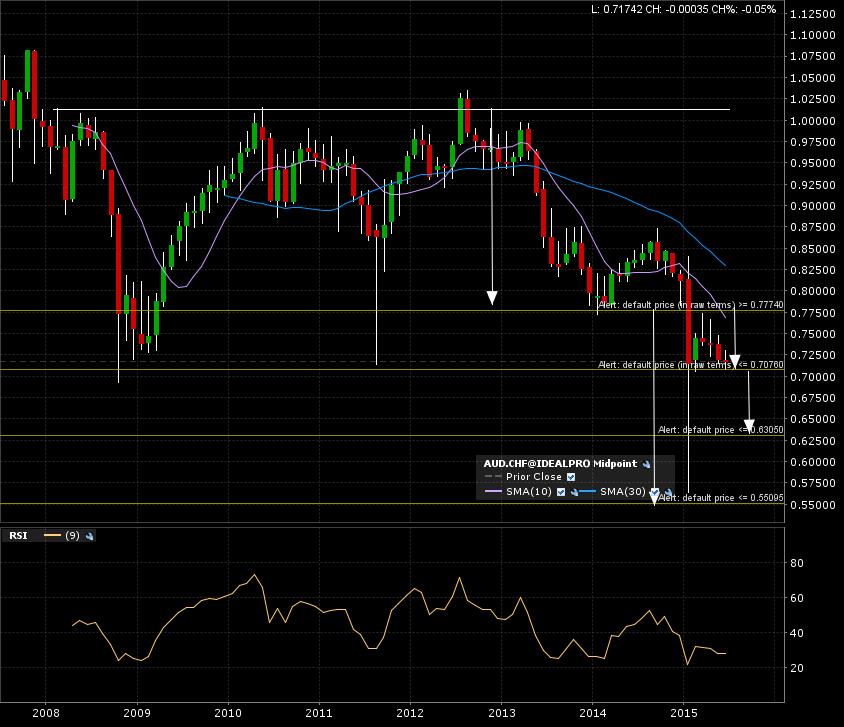
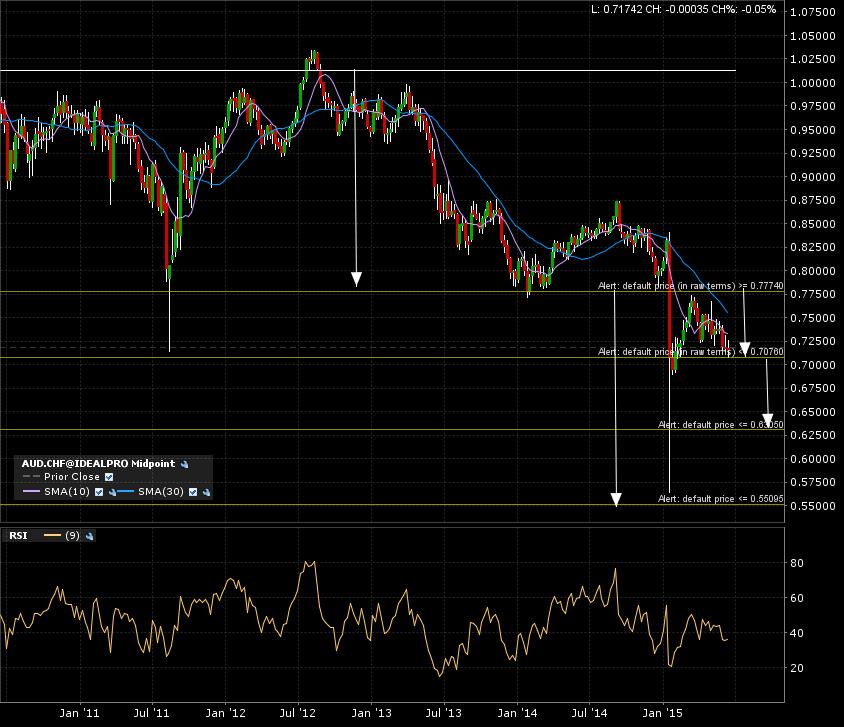
You can see on the 5 year weekly candle chart the continuation pattern having a coinciding break down linewith the larger top pattern. I believe this add value to the eventual break down, IF it occurs. The furthest target is 0.55.
Zoom in on the 1 year daily candle chart. The shorter pattern’s target is 0.63.
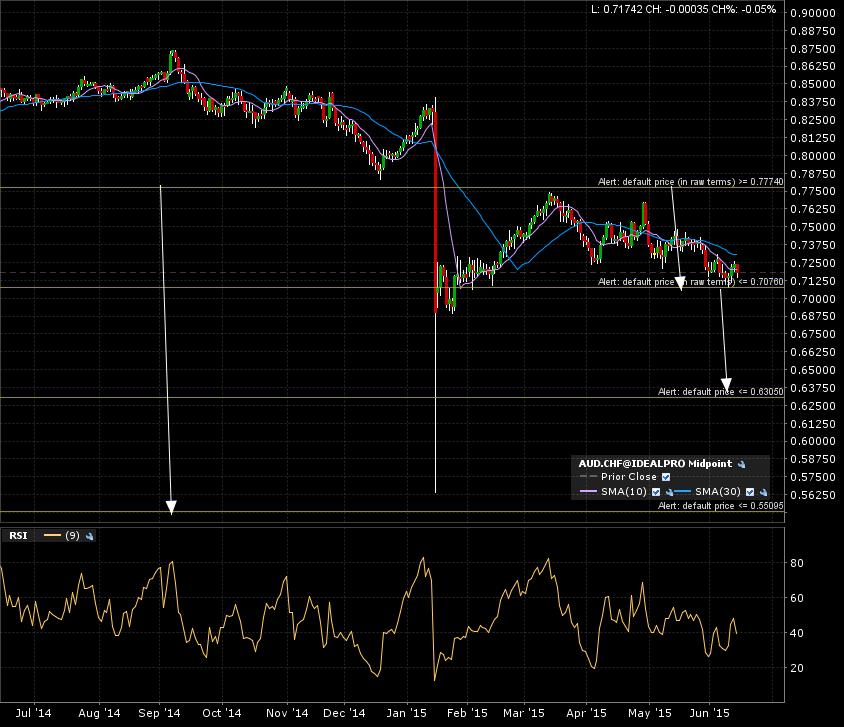
Will have to come back to this at the end of the current month. If a monthly candle close can occur under the break down line at 0.70, confirmation is obtained.