This is another example where is be best to wait for the monthly close (or at least weekly close) before entering the trade. Check this previous demonstration.
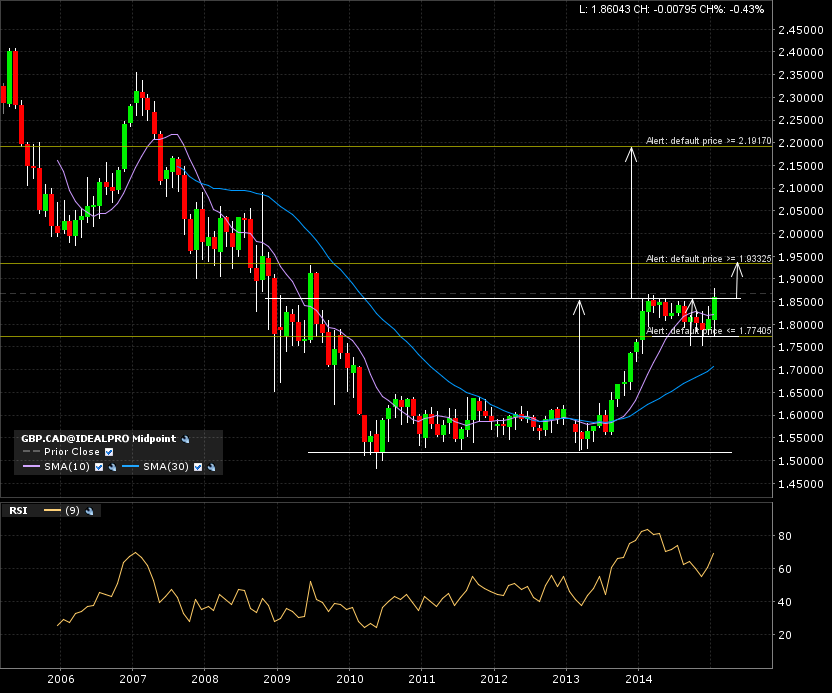
The Sterling tried recently to breakout of a 1 year bullish rectangle. Check out the monthly candle chart (10 years).
An immediate measured move to 1.95 if the pair can close above the 1.88 mark. It will also signal a bigger target from a 6 year base breakout at 2.20.
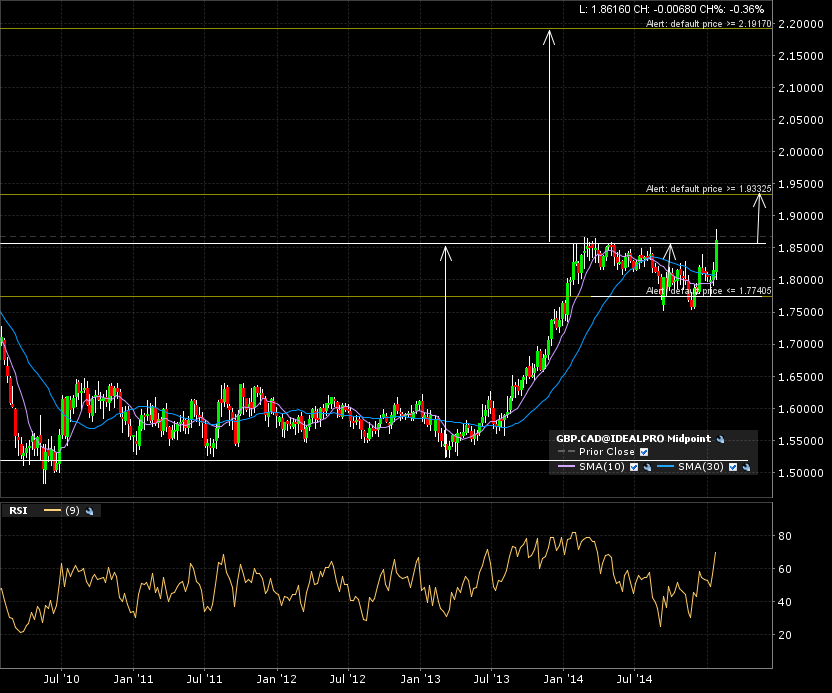
The weekly candle chart (5 years) shows the current candle retracing below the breakout line. Patience for now.
Zoom on the daily candle chart shows us that daily candle breakouts are more “delicate”. I believe they have less weight and momentum behind them. Reversals for a retest of a close by support level are more probable than with a weekly or even better, monthly close. Not an A+ setup.

I put an alert at 1.88 and will come back to this pair when it’s triggered. I also have an alert at 1.77, in case of an eventual bearish breakdown.
Remember, always to possible directions. You better see both before choosing one!