Axp is currently carving out a +1 year top consolidation pattern on the monthly candle 10 year chart. I have the breakdown line at the 71 mark. The implied measured move is added to the breakdown line for a target of 46.
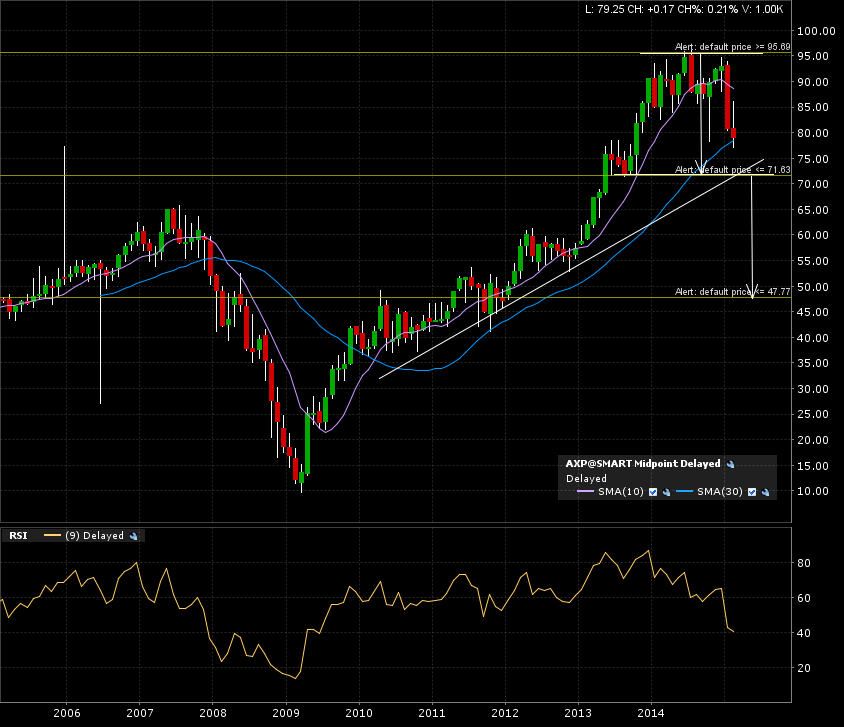
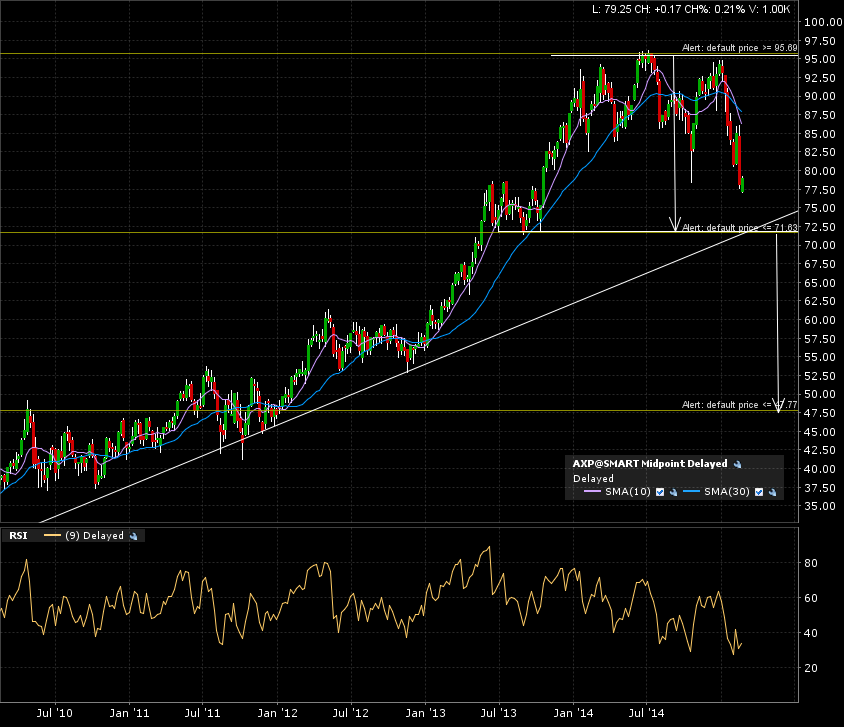
The zoom in on the weekly candle 5 year chart shows the breakout line crossing the ascending trend line which will serve as support. A coinciding break of both lines will add strength to the breakdown.
The daily candle 1 year chart gives us an idea that a few more days or weeks needed before we get to test that breakdown line.

Set your alerts and wait. I like to scan charts, evaluate eventual patterns, and wait. IF a monthly candle can close below 71, we are set to go. Else, this bearish scenario is invalid and a re evaluation most be done. Charts morph over time to form other and sometimes unexpected patterns.
I also set an alert at 95. IF that level is broken, a bullish scenario will be in the cards with a 120 target.
Hang tight and pay your bill!