Wrote a post on Jan 18 about Google and IBM. After following up on Google, I decided to check up on IBM. Here is the original post.
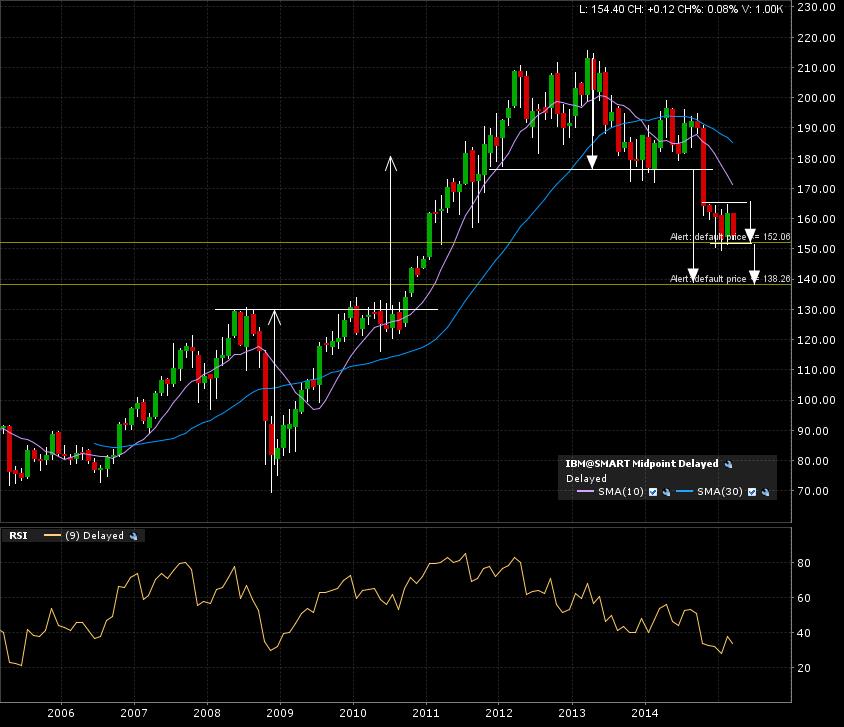
Here are the most recent charts, starting with the monthly candle 10 year chart. Arrows are the implied measured moves, added to the confirmed breakout lines. We now have a consolidation pattern on the way to now, two coinciding targets.
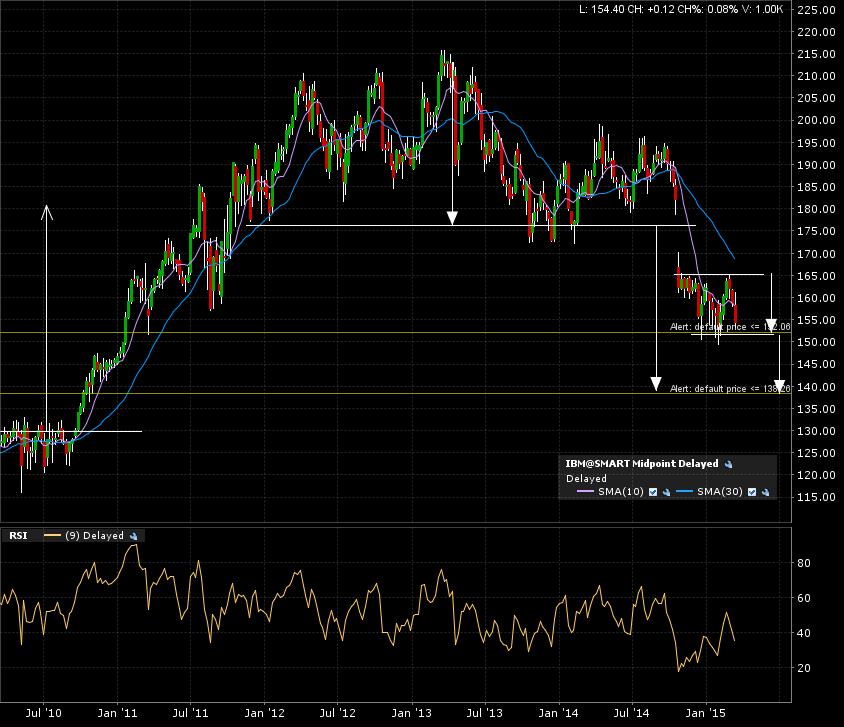
The weekly candle 5 year chart shows a clearer view of the arrows pointing to the 138 target. I previously had a 133 target. Sometimes I review a previous analysis for a chart and find a different target. Charts morph over time, and with time, a different slightly skewed picture can be seen. Nothing wrong with adapting.
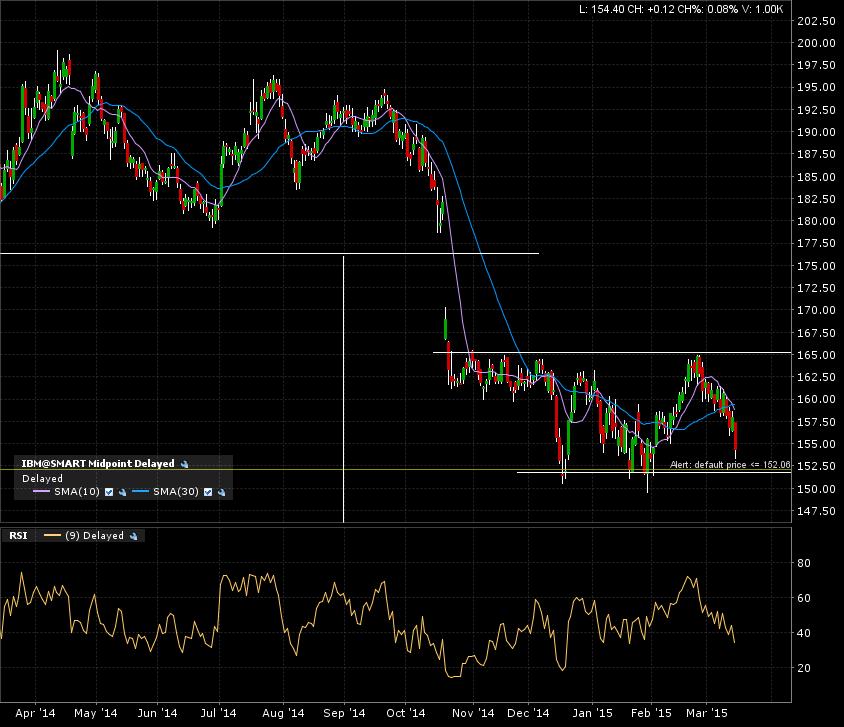
Here is the final zoom in on the daily candle 1 year chart. The price action is approaching another test of the breakdown line for the smaller consolidation pattern.
I set an alert at 152. A monthly close below this level would confirm the continuation towards the already valid 138 target.