iShares MSCI Italy Index (EWI:NYSEArca) is approaching the breakout line. Here is the monthly candle chart.
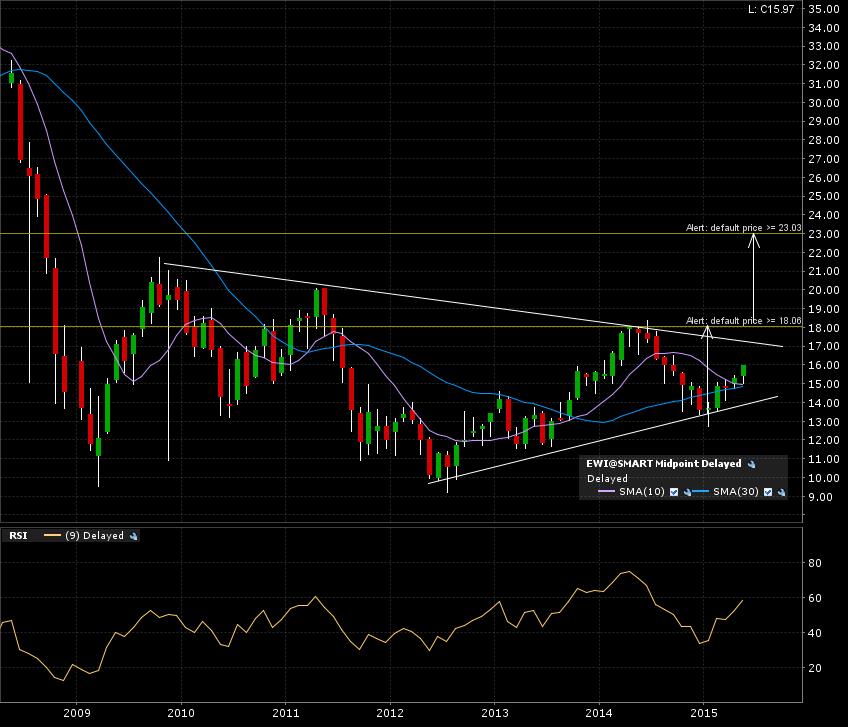
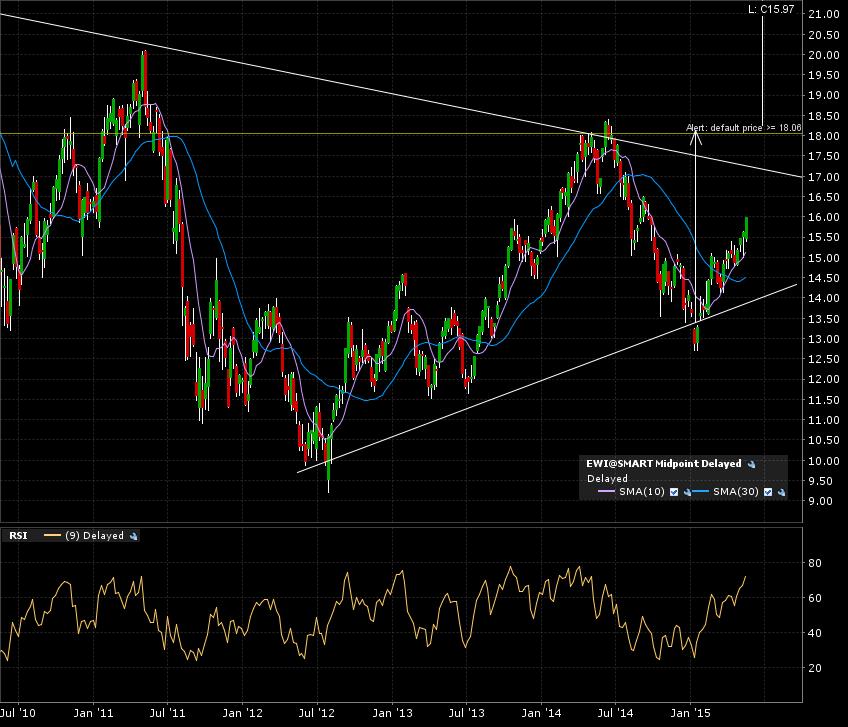
The 5 year weekly candle chart shows the price action trending towards the descending resistance trend line. I prefer horizontal line breakouts, so my alert is set at 18.
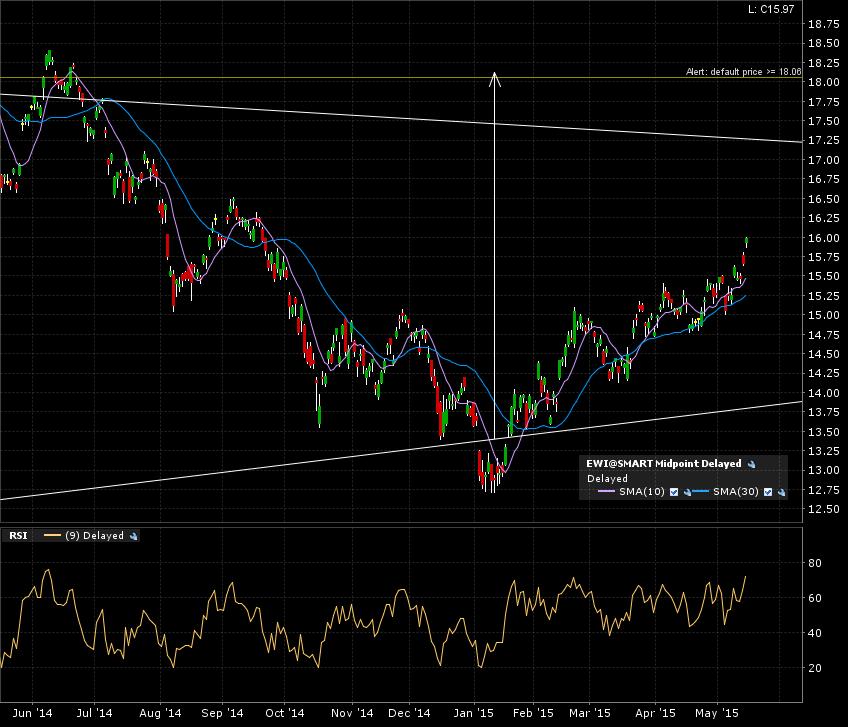
Zoom in on the 1 year daily candle chart. Recent bounce off the ascending support trend line. Right now in no man’s land.
Two steps needed to confirm breakout and measured move to the 23 target:
1- Break of the descending trend line.
2- Monthly candle close above the 18 mark.
Easy right? Patience will be the hardest part…