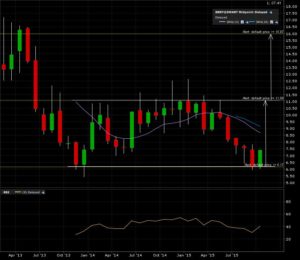
Is this a bottom carving out for Blackberry (BBRY:NASDAQ)? Let’s imagine so and look at the bullish scenario. The monthly candle graph below shows the move to 11 needed to reach the upper resistance line of the bottom formation.
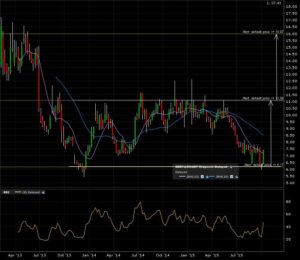
Here is the weekly candle chart. More of the same. Moving averages are still trending downwards. Is this still a falling knife?
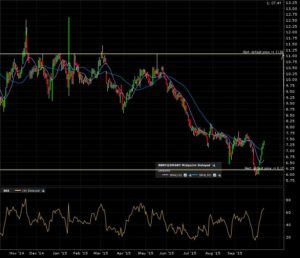
A final zoom in on the 1 year daily candle chart. A break above 8 would give some momentum to reach the 11 breakout line.
Can Blackberry be saved ? I set an intermediate alert at 8 and will come back when triggered. Right now, this is a hard play as the proverbial “catching a falling knife” is still in effect. I won’t even look at the next target if a bearish break below 6, yikes!


