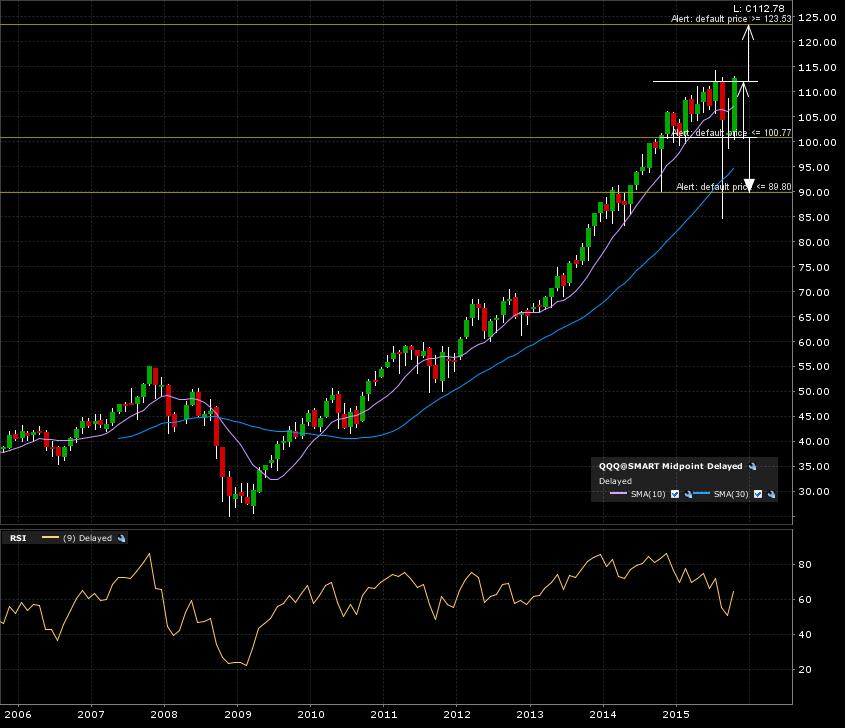
First, go look at this previous post for PowerShares Nasdaq-100 (QQQ:NASDAQ) written on February 19th. The bullish target of 113 has been hit. Now the chart has morphed into the next playable pattern. Check out the 10 year monthly candle chart below. A monthly close above 114 would give a measured move applied to the breakout line of 124.
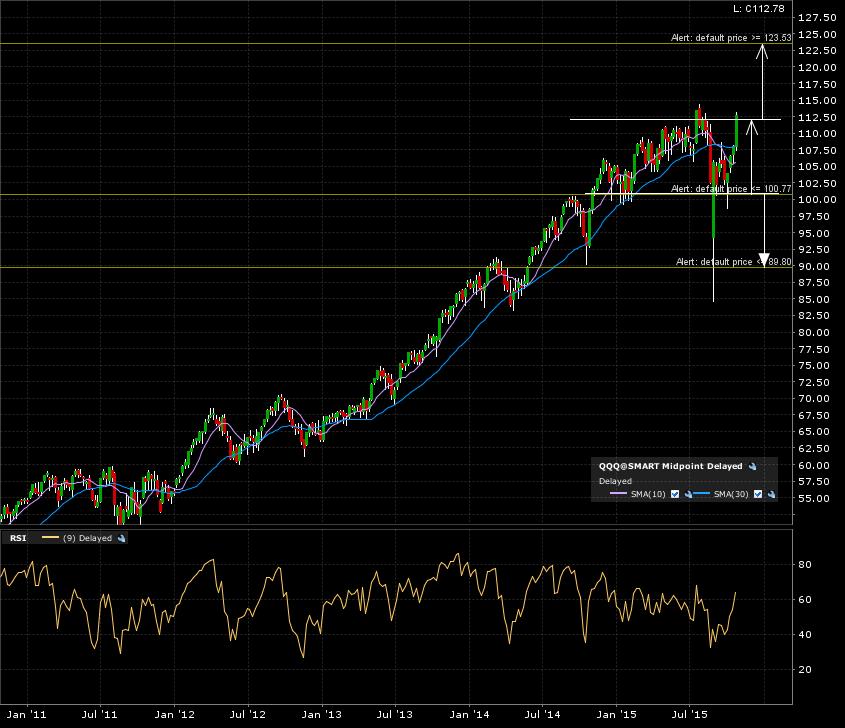
Here is the 5 year weekly candle chart. More of the same. Noise is visible below the breakdown line.
A final zoom in on the 1 year daily candle chart. That is a nice 1 year range which is being tested for a bullish resolve.

End of month is closing in. Keep a close eye on this for a close above the breakout line. Or else it’s back in the range until the next break line test.