I use the “macro to micro” or a “top to bottom” approach while doing my analysis of a specific instrument. This makes me understand or take notice of the more prevailing trend going on. If the monthly, weekly, and daily charts breakout in the same direction, I believe probabilities will be higher that my target will be achieved.
I give more weight or value to a multi year monthly candle chart breakout than a daily.
As the proverb goes… “The bigger the base, the higher in space”. Bonus value to using a monthly candle close are its “noise reduction” properties to help avoid whipsaws.
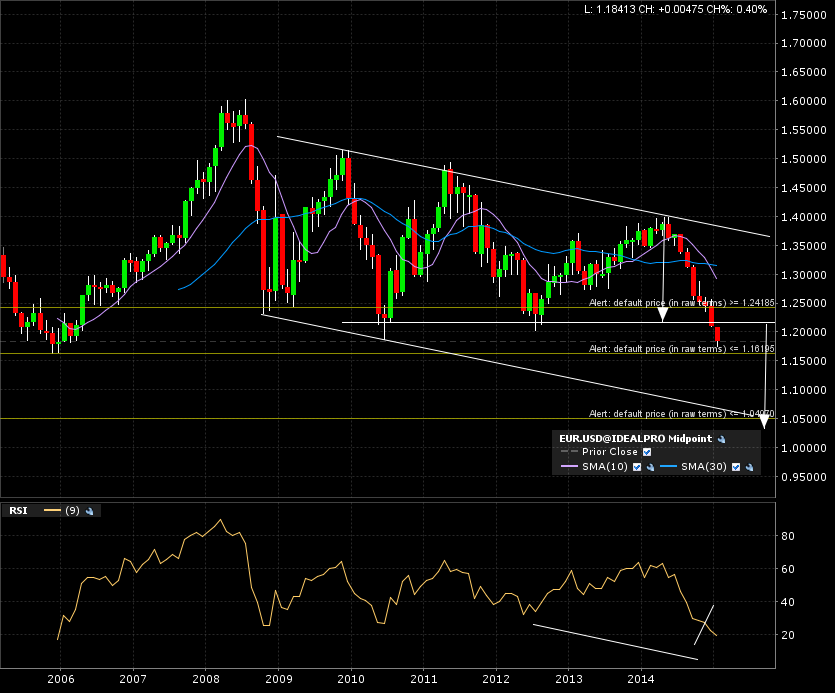
Breakdown in progress on monthly chart for eurusd.
Here is the 10 year chart with monthly candles:
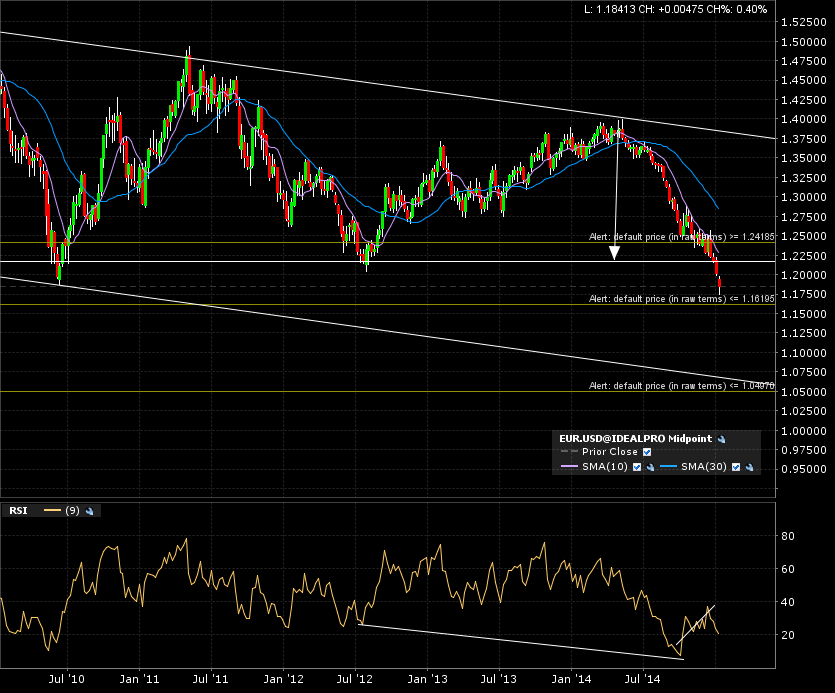
Here is the 5 year with weekly candles:
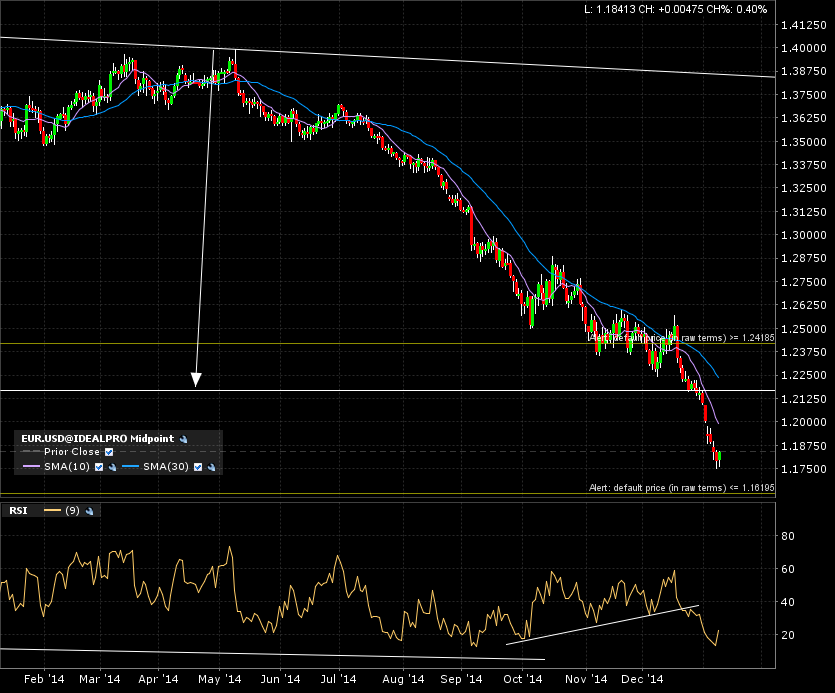
Finally, is the 1 year with daily candles:
Next step is determining entry and exits and used to determine risk to reward ratios (covered in next blog entry).