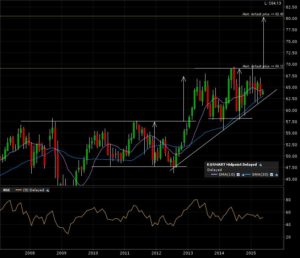
Kellogg Company (K:NYSE) has been consolidating for the past +2 years after reaching it’s previous target. This could be a top OR bottom. Right now, I’m looking at the bullish scenario. Here is the monthly candle chart.
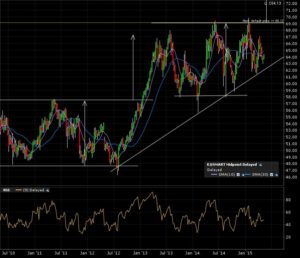
The 5 year weekly candle chart shows the recent tests of the ascending trend line. The breakout line is at 69.
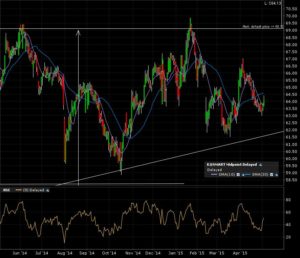
Zoom in on the 1 year daily candle chart. Price action in no man’s land. Many days needed before we get another test of the breakout line.
I have my alert set at 69. I’ll come back when it’s triggered. The next target of 80.50 will be confirmed after a convincing monthly candle close above the 69 mark.
Back to the patience game…


